
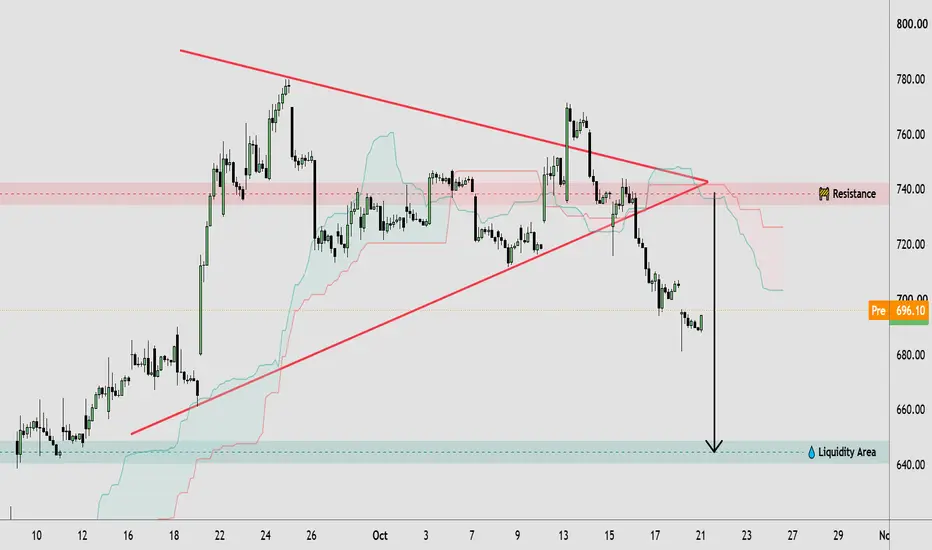
🔹 META has broken below the rising support trendline of its previous symmetrical triangle, suggesting a bearish shift in short-term market structure. After several rejections near the 740–750 resistance zone, price lost its ascending support and moved lower, forming a sequence of bearish candles and weaker price levels. The current price action near 695 indicates continued selling pressure, while the highlighted liquidity area around 640–650 represents a potential downside zone to watch. This breakdown suggests that buyers are struggling to regain control unless price recovers above the broken trendline and key resistance.
🔸 From a technical analysis perspective, META could continue toward the lower liquidity zone if bearish momentum persists and the breakdown remains confirmed. However, a recovery above the broken support and a sustained move back toward resistance could indicate a potential bullish recovery or a false breakout. Traders may wait for price confirmation and a clear market-structure shift before considering any trade. If the current bearish structure holds, downside liquidity may remain in focus; if resistance is reclaimed, the bearish outlook could weaken.
This analysis is for educational purposes only and does not constitute financial or investment advice. Always conduct your own research before making trading decisions.
交易开始
交易结束:到达目标

📲 Join Our Telegram Community
t.me/+rSX57G_rhcFlMTA0
t.me/+rSX57G_rhcFlMTA0
相关出版物
免责声明
这些信息和出版物并非旨在提供,也不构成TradingView提供或认可的任何形式的财务、投资、交易或其他类型的建议或推荐。请阅读使用条款了解更多信息。
📲 Join Our Telegram Community
t.me/+rSX57G_rhcFlMTA0
t.me/+rSX57G_rhcFlMTA0
相关出版物
免责声明
这些信息和出版物并非旨在提供,也不构成TradingView提供或认可的任何形式的财务、投资、交易或其他类型的建议或推荐。请阅读使用条款了解更多信息。