做多
MITHRIL-MITH/BTC-SETUP
Mithril is a decentralized mobile game ad platform which aims to dramatically improve ad efficiency by eliminating middlemen intervention and connecting gamers and gaming companies directly using verified gamer's blockchain data.
There are upcoming catalyst(news) for the asset which are MCX atomic drops for MITH holders and Vault payment alpha and beta launch in Q1, 2019(end of march'2019).
It might affect its price so let's analyze the daily Timeframe chart of the pair to know levels to buy for upside potential.
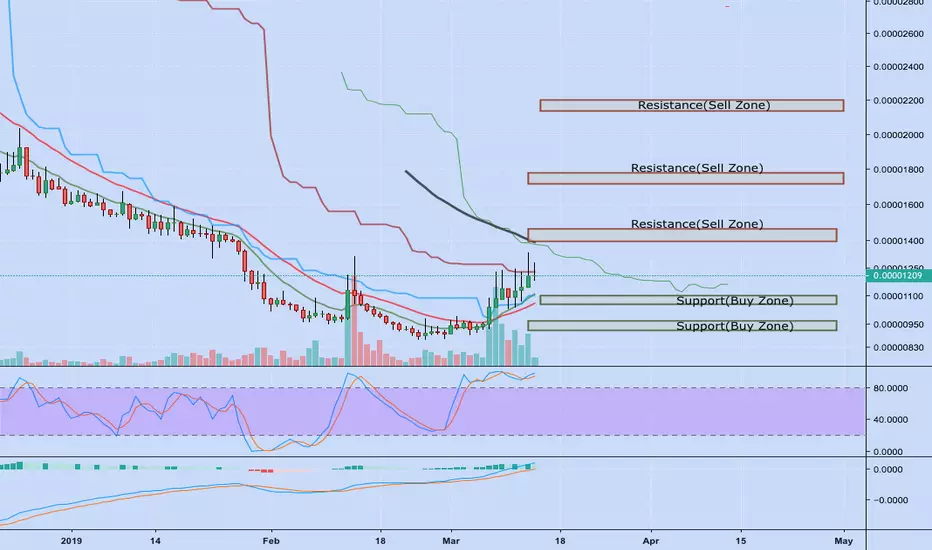
MITH/BTC pair has been trending up since 25th February'2019 and have surged 50+% since then.
We can see the price reaching support level 0.00001100-0.000011051 satoshi where interested buyers can look for these levels to enter for safe entry.
If the 0.00001100-0.000011051 satoshi level is not held then one can look for buying around 0.0000914-0.0000966 satoshi level with a tight stop-loss.
Sellers can look for two potential resistance zone around 0.00001398-0.00001468 satoshi and 0.00001712-0.00001784 satoshi to book profits. Also STOCH-RSI indicator in the overbought zone and MACD is curving down showing signs for correction downside.
Caution: If the last line of support 0.0000865-0.0000840 satoshi level is broken then one should not hold the coin as it would be strongly bearish(sell signal) for the asset.
There are upcoming catalyst(news) for the asset which are MCX atomic drops for MITH holders and Vault payment alpha and beta launch in Q1, 2019(end of march'2019).
It might affect its price so let's analyze the daily Timeframe chart of the pair to know levels to buy for upside potential.
MITH/BTC pair has been trending up since 25th February'2019 and have surged 50+% since then.
We can see the price reaching support level 0.00001100-0.000011051 satoshi where interested buyers can look for these levels to enter for safe entry.
If the 0.00001100-0.000011051 satoshi level is not held then one can look for buying around 0.0000914-0.0000966 satoshi level with a tight stop-loss.
Sellers can look for two potential resistance zone around 0.00001398-0.00001468 satoshi and 0.00001712-0.00001784 satoshi to book profits. Also STOCH-RSI indicator in the overbought zone and MACD is curving down showing signs for correction downside.
Caution: If the last line of support 0.0000865-0.0000840 satoshi level is broken then one should not hold the coin as it would be strongly bearish(sell signal) for the asset.

免责声明
这些信息和出版物并非旨在提供,也不构成TradingView提供或认可的任何形式的财务、投资、交易或其他类型的建议或推荐。请阅读使用条款了解更多信息。
免责声明
这些信息和出版物并非旨在提供,也不构成TradingView提供或认可的任何形式的财务、投资、交易或其他类型的建议或推荐。请阅读使用条款了解更多信息。