U.S. markets up from here? Percent of stocks >200ma is rising.
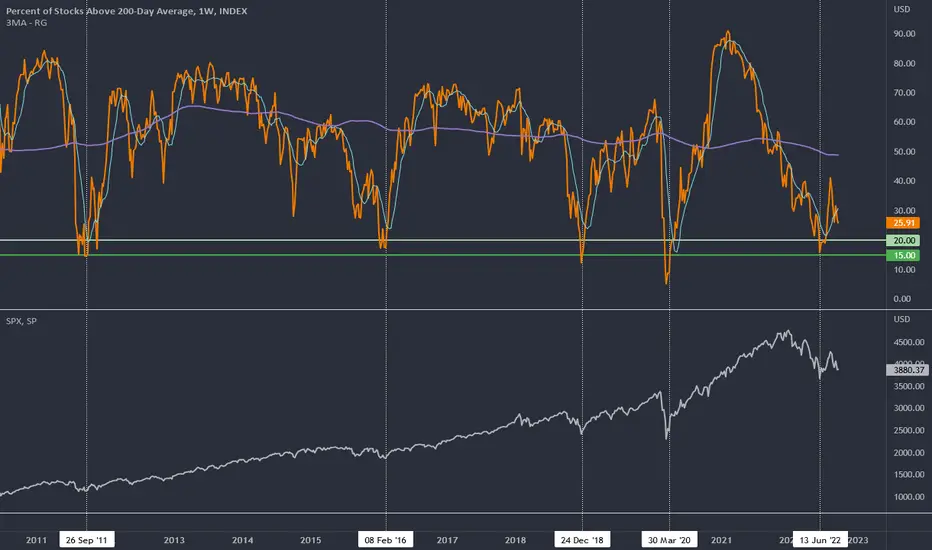
The vertical lines match  SPX lows with times when only 15-20% of stocks traded over their 200ma. The light blue line is a 10-week moving average and you can see that once it turns up it keeps rising (2008-09 was an exception). According to this broad market indicator, stocks have been performing better since early July.
This is a big picture view, not to be used for short term trading. This index is a useful way to evaluate overall market condition, especially for active investing decisions.
Considering this index is closer to 20 than to 50, it is possible that even if stocks are broadly sold again, there will soon enough be a substantial rise in stock prices. The exception to all of this - if "this time is different" is true. If all the Covid-induced money printing has damaged the system so much that worse extremes will be needed to make amends, then the usual historical patterns may all go out the window.
SPX lows with times when only 15-20% of stocks traded over their 200ma. The light blue line is a 10-week moving average and you can see that once it turns up it keeps rising (2008-09 was an exception). According to this broad market indicator, stocks have been performing better since early July.This is a big picture view, not to be used for short term trading. This index is a useful way to evaluate overall market condition, especially for active investing decisions.
Considering this index is closer to 20 than to 50, it is possible that even if stocks are broadly sold again, there will soon enough be a substantial rise in stock prices. The exception to all of this - if "this time is different" is true. If all the Covid-induced money printing has damaged the system so much that worse extremes will be needed to make amends, then the usual historical patterns may all go out the window.

免责声明
这些信息和出版物并非旨在提供,也不构成TradingView提供或认可的任何形式的财务、投资、交易或其他类型的建议或推荐。请阅读使用条款了解更多信息。
免责声明
这些信息和出版物并非旨在提供,也不构成TradingView提供或认可的任何形式的财务、投资、交易或其他类型的建议或推荐。请阅读使用条款了解更多信息。