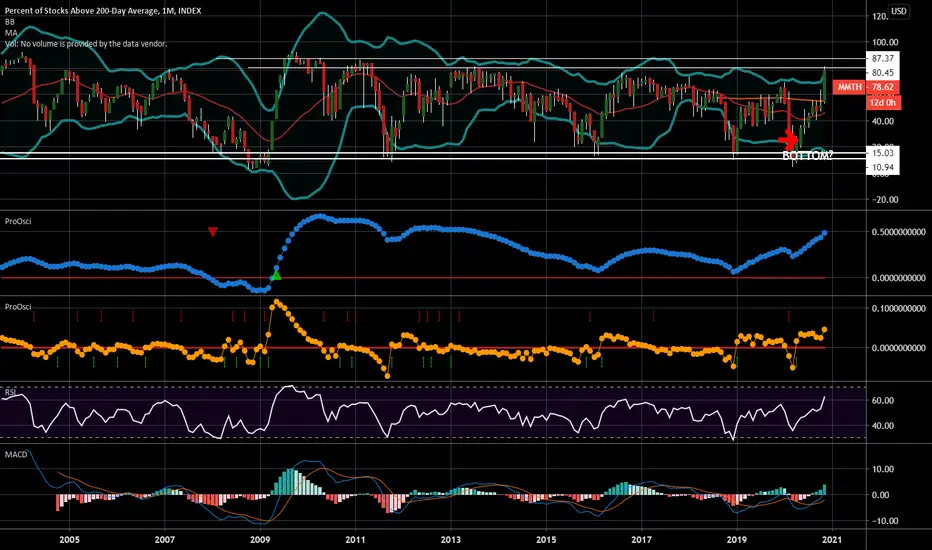
This chart is the monthly chart of % of stocks above their 200 Day Moving Average and when it gets to these levels the market will reverse direction. Greed is at extreme and the RISK greatly outweighs the potential return on a portfolio. Now would be the time to tighten up stop losses, reduce positions or outright sell positions as the market is vulnerable to bad news and could collapse quickly.

免责声明
这些信息和出版物并非旨在提供,也不构成TradingView提供或认可的任何形式的财务、投资、交易或其他类型的建议或推荐。请阅读使用条款了解更多信息。
免责声明
这些信息和出版物并非旨在提供,也不构成TradingView提供或认可的任何形式的财务、投资、交易或其他类型的建议或推荐。请阅读使用条款了解更多信息。