
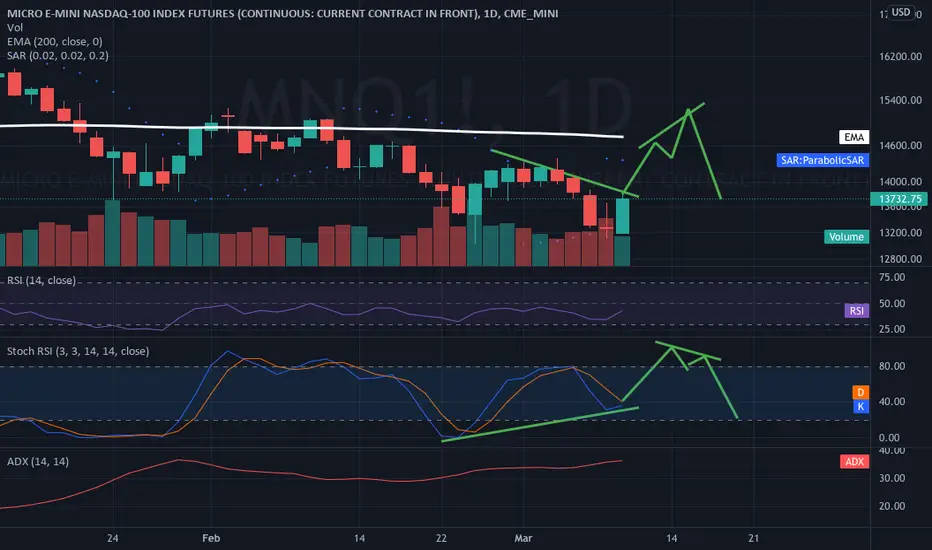
Here is an idea of what may happen. This is not a prediction but more of a tutorial in what to look for in the daily time frame of negative divergence.
Of course this could be wrong and the bulls buy this to ATHs (all time highs) but I suspect the markets will sell off eventually. And this chart will prepare you
to look for evidence that the markets will turn down on the daily time frame.
Of course this could be wrong and the bulls buy this to ATHs (all time highs) but I suspect the markets will sell off eventually. And this chart will prepare you
to look for evidence that the markets will turn down on the daily time frame.
注释
That did not move according to plan. That happens. Monthly stll oversold so I will just stay out for now. Zigzags is where I tend to lose.
免责声明
这些信息和出版物并非旨在提供,也不构成TradingView提供或认可的任何形式的财务、投资、交易或其他类型的建议或推荐。请阅读使用条款了解更多信息。