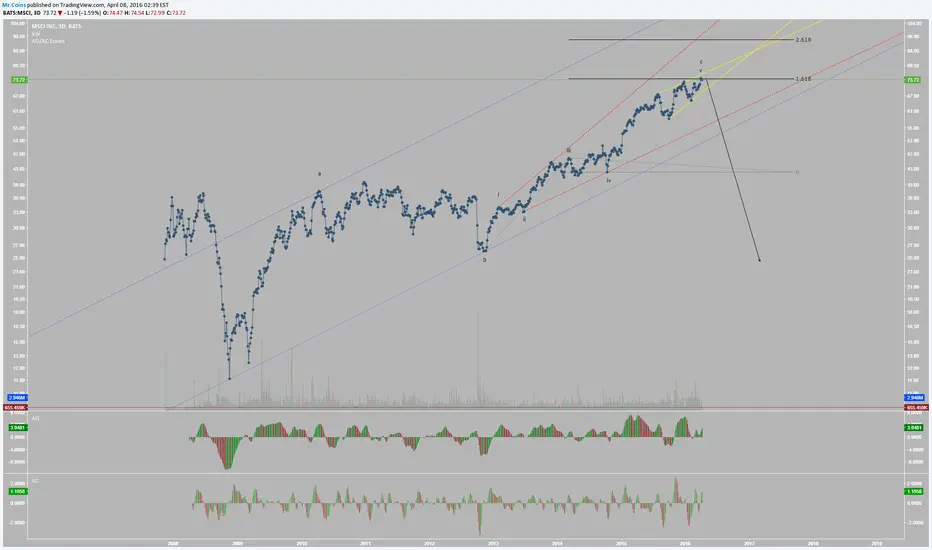
What is this chart? This is the Real-Estate Investment Trust (REIT)  MSCI it is the underlying asset for the 3xLeveraged Short Real-Estate ETF $DRV.
Why is it important? Because if you buy DRV during a housing market crash you can make some pretty insane returns, and if you look at the Elliott Wave count (unconfirmed) you will see that MSCI has possibly just completed Wave-c of an Extended Zigzag. Since it also ended with a terminal impulse it means that at a minimum Wave-c needs to be completely retraced but since we are completing an extended zigzag, and we are most likely in a triangle, it is highly unlikely that we'd retrace ALL of the entire zigzag because, based on my stock market count, we are in the 2nd "Three" of a major correction that started in 2000.
What does this mean? It means that if my chart is correct the Real-Estate market, and the US Economy, is about to collapse. The process will be slow and painful but this is a perfect starting point for it., the stock market is also reaching a nice high at this point it has basically triple topped. It seems like my related chart will probably continue to be right and the stock market growth will pretty much come to a halt and then the whole market will fall through the floor after about a year. I except there to be blood in the streets by the end of this. It will be at least as bad as 2007-09.
So how do we know if this chart is right? Well first of all it's still extremely speculative (lower probability), if you wait for it to first break the lower yellow line, and then to break the red and blue lines, it will have more or less confirmed the Wave-c impulse and also the entire Zigzag. If you wait until the blue line there is still plenty of profit left but you did miss out on quite a bit (especially onDRV) so it may be a good idea to take the risk of being wrong and start moving capital into this trade now. Since Wave-c ends on a terminal it needs to retrace the terminal in 50% or less time it took, and typically its much faster than that. This means that if this chart does end up being right the housing market (and in particular MSCI) is going to crash very fast and very hard within the next year.
How do we know if this chart is wrong? Well this would be the tippy top so if it moves up even a little bit from here it would be a good idea to stop-out and wait for a break down before taking this trade. That means that if you take the trade now onDRV your R/R is over 1:1000. If you wait until there's a break down your R/R isn't quite as fantastic but the probability that this chart is correct increases substantially because it eliminates any other possibilities I may have overlooked.
Remember thatDRV is the big play here. The gains made from shorting MSCI are nothing compared to what DRV could be worth in a recession. The only reason we look at MSCI is because it is the underlying asset for DRV and because it's wave patterns are much more clear. Again this is a very speculative and risky trade at this point it's definitely not recommend that you get overly aggressive until this trade has more confirmations!
The clouds are definitely dark over Cyclical City, I would be seriously cautious about being invested in housing and anything that is cyclical in nature for the next couple of years. The market has had a good run for the last 7 years but now it looks like its time for the cycles to change and for the Economy to once again enter into a bearish period.
MSCI it is the underlying asset for the 3xLeveraged Short Real-Estate ETF $DRV.Why is it important? Because if you buy
DRV during a housing market crash you can make some pretty insane returns, and if you look at the Elliott Wave count (unconfirmed) you will see that MSCI has possibly just completed Wave-c of an Extended Zigzag. Since it also ended with a terminal impulse it means that at a minimum Wave-c needs to be completely retraced but since we are completing an extended zigzag, and we are most likely in a triangle, it is highly unlikely that we'd retrace ALL of the entire zigzag because, based on my stock market count, we are in the 2nd "Three" of a major correction that started in 2000.What does this mean? It means that if my chart is correct the Real-Estate market, and the US Economy, is about to collapse. The process will be slow and painful but this is a perfect starting point for it., the stock market is also reaching a nice high at this point it has basically triple topped. It seems like my related chart will probably continue to be right and the stock market growth will pretty much come to a halt and then the whole market will fall through the floor after about a year. I except there to be blood in the streets by the end of this. It will be at least as bad as 2007-09.
So how do we know if this chart is right? Well first of all it's still extremely speculative (lower probability), if you wait for it to first break the lower yellow line, and then to break the red and blue lines, it will have more or less confirmed the Wave-c impulse and also the entire Zigzag. If you wait until the blue line there is still plenty of profit left but you did miss out on quite a bit (especially on
DRV) so it may be a good idea to take the risk of being wrong and start moving capital into this trade now. Since Wave-c ends on a terminal it needs to retrace the terminal in 50% or less time it took, and typically its much faster than that. This means that if this chart does end up being right the housing market (and in particular MSCI) is going to crash very fast and very hard within the next year.How do we know if this chart is wrong? Well this would be the tippy top so if it moves up even a little bit from here it would be a good idea to stop-out and wait for a break down before taking this trade. That means that if you take the trade now on
DRV your R/R is over 1:1000. If you wait until there's a break down your R/R isn't quite as fantastic but the probability that this chart is correct increases substantially because it eliminates any other possibilities I may have overlooked. Remember that
DRV is the big play here. The gains made from shorting MSCI are nothing compared to what DRV could be worth in a recession. The only reason we look at MSCI is because it is the underlying asset for DRV and because it's wave patterns are much more clear. Again this is a very speculative and risky trade at this point it's definitely not recommend that you get overly aggressive until this trade has more confirmations!The clouds are definitely dark over Cyclical City, I would be seriously cautious about being invested in housing and anything that is cyclical in nature for the next couple of years. The market has had a good run for the last 7 years but now it looks like its time for the cycles to change and for the Economy to once again enter into a bearish period.
注释
I just realized this chart is actually for the MSCI Inc. Stock, and not the MSCI REIT Index that DRV is inversely backed by, so while the above Elliott Wave Analysis may be valid for the stock, this actually doesn't really apply to DRV Directly, but it could be very telling of the overall health of the economy because MSCI Inc. is a US-based provider of equity, fixed income, and hedge fund stock market indexes, and equity portfolio analysis tools. So the fact that this company looks like it just reached a peak at the same time as the stock market could be very telling of the overall strength of the economy.注释
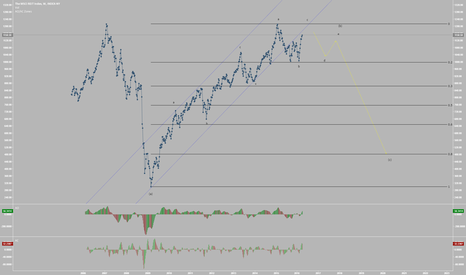
This is the chart that is more relevant to DRV. RMZ is the actual index, this chart is actually just the stock for the company that makes the RMZ index. It's interesting though, that a company that makes indexes looks so bearish right when it looks like many of the indexes have peaked out. MSCI stock tends to follow the stock market and the economy pretty closely.

Find me on x.com/intuit_trading
相关出版物
免责声明
这些信息和出版物并非旨在提供,也不构成TradingView提供或认可的任何形式的财务、投资、交易或其他类型的建议或推荐。请阅读使用条款了解更多信息。
Find me on x.com/intuit_trading
相关出版物
免责声明
这些信息和出版物并非旨在提供,也不构成TradingView提供或认可的任何形式的财务、投资、交易或其他类型的建议或推荐。请阅读使用条款了解更多信息。