
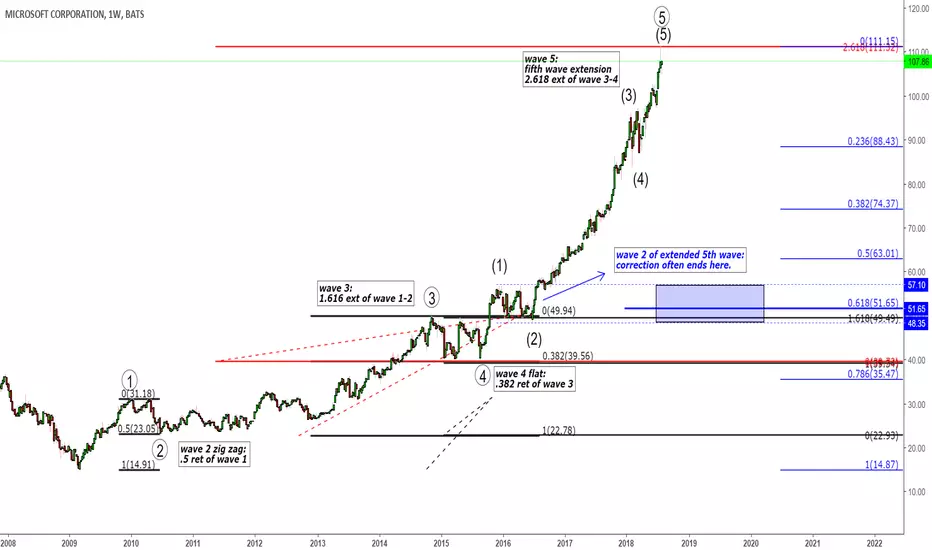
This is a W1 chart of Microsoft.
The purpose of this post is to follow major companies whose share price affect the general financial market in order to anticipate the depression/recession that is to come.
This analysis is based on EWP in combination with fibonacci levels, and some reversal candle stick formation in the end.
After the correction of 2008-2009, MSFT began to develop wave 3 of a larger degree (Starting from Sep2019).
All wave count is on the chart and we now have a completed 5 wave structure to make wave 3.
This wave three structure took approximately 9 years to build, and it fits fibonacci levels perfectly!
Wave 2 is .5 ret of wave 1.
Wave 4 is .382 ret of wave 3.
Wave 3 is a 1.618 ext of wave 1-2.
Wave 5 is a 2.618 ext of wave 3-4.
Although fifth wave extension is uncommon in equity market, we cannot discard the possibility of this scenario with clear wave structures.
Wave 5 extension personality: it often retraces to the wave 2 region of the extended fifth wave (labelled with blue dotted lines.) ***This region coincides with .618 retracement of the entire wave 3 structure of one larger degree.
Candlestick:
Reversal pattern is in print with: a spinning top (2 weeks ago as I am writing this); a shooting star (last week as I am writing this, with its upper wick landing right on the 2.618 ext of wave 3-4!!).
And now, we have a hanging man in print (Have to wait for week to close).
In summary, all the stars are in line for MSFT to suffer a correction.
Using knowledge of wave personalities, it is extremely possible that MSFT may lose more than half of its current share value within the coming years.
The purpose of this post is to follow major companies whose share price affect the general financial market in order to anticipate the depression/recession that is to come.
This analysis is based on EWP in combination with fibonacci levels, and some reversal candle stick formation in the end.
After the correction of 2008-2009, MSFT began to develop wave 3 of a larger degree (Starting from Sep2019).
All wave count is on the chart and we now have a completed 5 wave structure to make wave 3.
This wave three structure took approximately 9 years to build, and it fits fibonacci levels perfectly!
Wave 2 is .5 ret of wave 1.
Wave 4 is .382 ret of wave 3.
Wave 3 is a 1.618 ext of wave 1-2.
Wave 5 is a 2.618 ext of wave 3-4.
Although fifth wave extension is uncommon in equity market, we cannot discard the possibility of this scenario with clear wave structures.
Wave 5 extension personality: it often retraces to the wave 2 region of the extended fifth wave (labelled with blue dotted lines.) ***This region coincides with .618 retracement of the entire wave 3 structure of one larger degree.
Candlestick:
Reversal pattern is in print with: a spinning top (2 weeks ago as I am writing this); a shooting star (last week as I am writing this, with its upper wick landing right on the 2.618 ext of wave 3-4!!).
And now, we have a hanging man in print (Have to wait for week to close).
In summary, all the stars are in line for MSFT to suffer a correction.
Using knowledge of wave personalities, it is extremely possible that MSFT may lose more than half of its current share value within the coming years.
注释
Hanging man close on weekly.
The reversal pattern is strong.
注释
invalidated
免责声明
这些信息和出版物并非旨在提供,也不构成TradingView提供或认可的任何形式的财务、投资、交易或其他类型的建议或推荐。请阅读使用条款了解更多信息。
免责声明
这些信息和出版物并非旨在提供,也不构成TradingView提供或认可的任何形式的财务、投资、交易或其他类型的建议或推荐。请阅读使用条款了解更多信息。