
Hi traders
Ever woundered - "can i beat the market ?" or "what is my Edge ?"
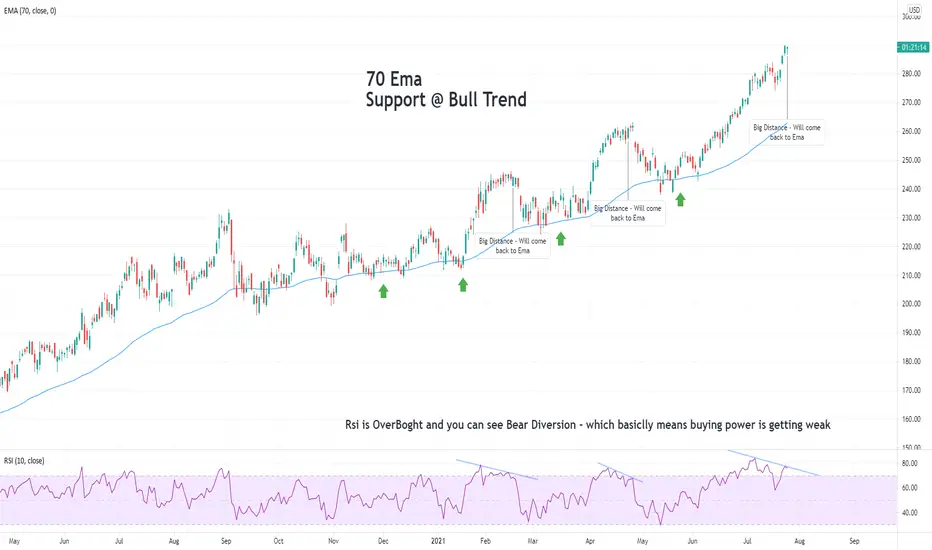
try the 70 Ema !!
i will use daily chart
and look for clear trend direction
apply indicator called Moving Avarage Exponential and set it to 70
-- UPTREND --
on an uptrend look if the line support the price.
you will want to go long when price reach the blue line.
on the other hand, price tends to "come back" to the Ema, so you can try short if price is to far up (see microsoft chart)
combined with RSI indicator, you can get better feeling if the price is overboght (and go short) or oversold (and go long)
-- DOWNTREND --
On downtrend the 70 Ema will act as RESISTANCE - see BABA chart
same here - price tends to "come back" to the Ema ...
Good Luck
Ever woundered - "can i beat the market ?" or "what is my Edge ?"
try the 70 Ema !!
i will use daily chart
and look for clear trend direction
apply indicator called Moving Avarage Exponential and set it to 70
-- UPTREND --
on an uptrend look if the line support the price.
you will want to go long when price reach the blue line.
on the other hand, price tends to "come back" to the Ema, so you can try short if price is to far up (see microsoft chart)
combined with RSI indicator, you can get better feeling if the price is overboght (and go short) or oversold (and go long)
-- DOWNTREND --
On downtrend the 70 Ema will act as RESISTANCE - see
BABA chart same here - price tends to "come back" to the Ema ...
Good Luck
注释
DowntrendBABA注释
Price will come back to EMA

免责声明
这些信息和出版物并非旨在提供,也不构成TradingView提供或认可的任何形式的财务、投资、交易或其他类型的建议或推荐。请阅读使用条款了解更多信息。
免责声明
这些信息和出版物并非旨在提供,也不构成TradingView提供或认可的任何形式的财务、投资、交易或其他类型的建议或推荐。请阅读使用条款了解更多信息。