
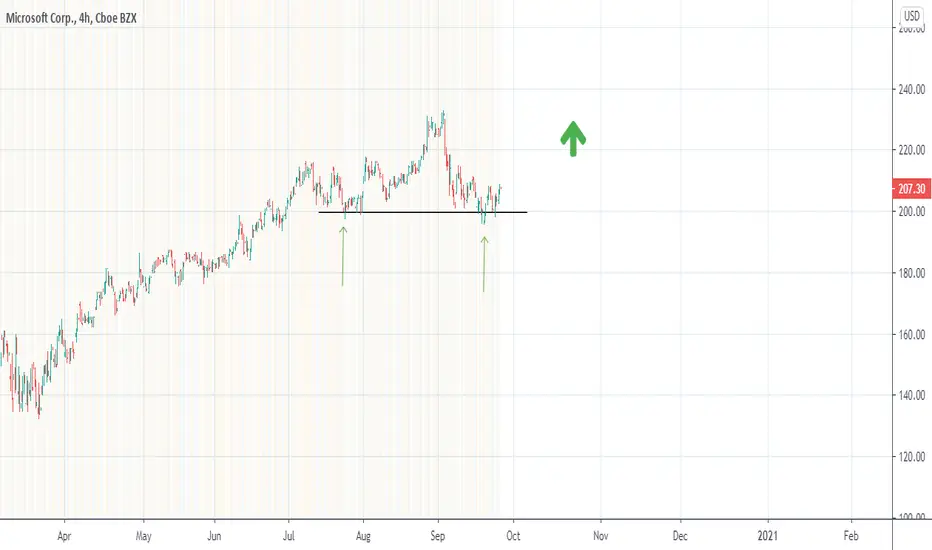
After the fall of these last weeks (fall that has occurred in all markets, not in Microsoft exclusively), a rejection at lower prices appears again (the last arrow), prices that have already been tested (in the first arrow)
Is this a double bottom pattern or is it in range?
I would say that it is a semi-range with greatly bullish connotations, personally I would open a bullish ratio straddle 2: 1
Is this a double bottom pattern or is it in range?
I would say that it is a semi-range with greatly bullish connotations, personally I would open a bullish ratio straddle 2: 1

免责声明
这些信息和出版物并非旨在提供,也不构成TradingView提供或认可的任何形式的财务、投资、交易或其他类型的建议或推荐。请阅读使用条款了解更多信息。
免责声明
这些信息和出版物并非旨在提供,也不构成TradingView提供或认可的任何形式的财务、投资、交易或其他类型的建议或推荐。请阅读使用条款了解更多信息。