Microsoft -  MSFT
MSFT
Long Term Chart
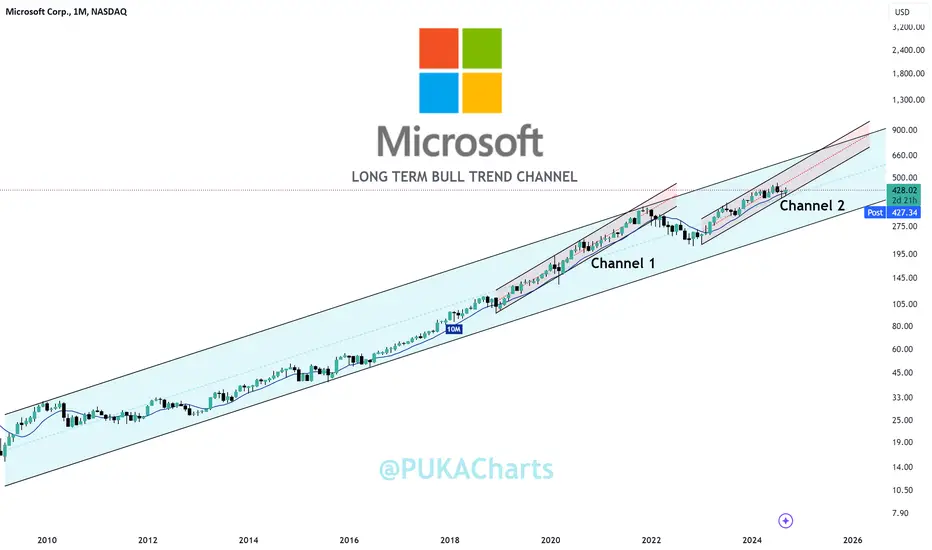
▫️ An incredible long term trending channel.
▫️ Lets zoom in on Channel 1 and Channel 2
I have compared the 2019 - 2022 period(Channel 1) to the current 2022 - 2024 period (Channel 2) .
Channel 1
2019 -2022

Channel 2
2022 -2024

▫️ Both of these periods have had parallel channels with the 200 day SMA acting as underside support.
▫️ When these were both lost in Q1 2022, it led to an approx. 38% decline from the highs, or a c. 28% decline from losing the channel or 200 DSMA level.
▫️ This is a very strong chart. Unless the channel is lost which sync's up with a loss of the 200 day moving average (approx. $410), intermediate trend looks intact for continued upwards trajectory.
PUKA
MSFTLong Term Chart
▫️ An incredible long term trending channel.
▫️ Lets zoom in on Channel 1 and Channel 2
I have compared the 2019 - 2022 period(Channel 1) to the current 2022 - 2024 period (Channel 2) .
Channel 1
2019 -2022
Channel 2
2022 -2024
▫️ Both of these periods have had parallel channels with the 200 day SMA acting as underside support.
▫️ When these were both lost in Q1 2022, it led to an approx. 38% decline from the highs, or a c. 28% decline from losing the channel or 200 DSMA level.
▫️ This is a very strong chart. Unless the channel is lost which sync's up with a loss of the 200 day moving average (approx. $410), intermediate trend looks intact for continued upwards trajectory.
PUKA

免责声明
这些信息和出版物并非旨在提供,也不构成TradingView提供或认可的任何形式的财务、投资、交易或其他类型的建议或推荐。请阅读使用条款了解更多信息。