做多
MTLBTC-Daily-Symmetrical triangle potentially confirming uptrend
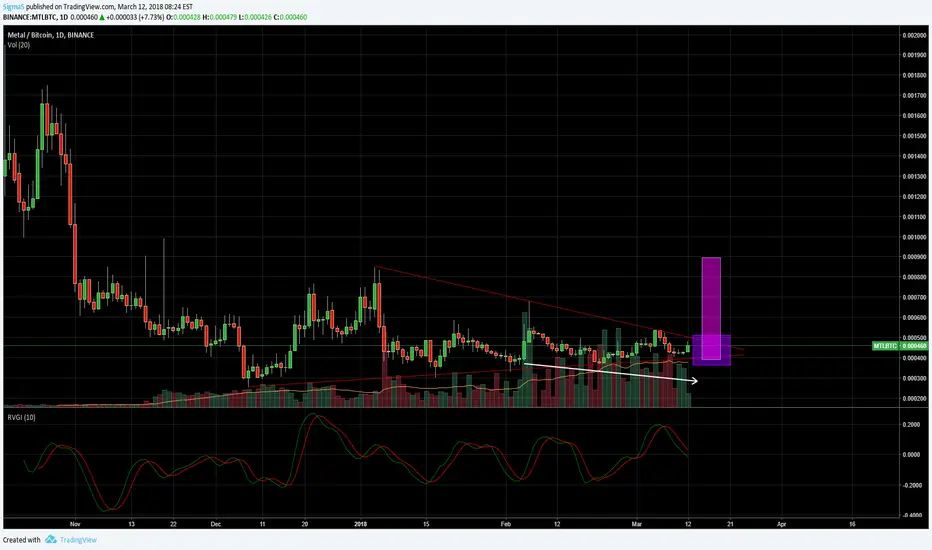
MTLBTC on the 1D chart is looking absolutely juicy. As consolidation into the apex continues, we see declining volume tightening as it prepares for its move up. The symmetrical triangle is indicative of a continue uptrend, of which MTLBTC has been in for a few months now. Purple zone is the desired breakout/breakdown point, while the pink zone is the potential price target. 600 satos is a potential resistance point. Watch for the RVGI signal line to cross.The fundamentals, namely the Q1 release of the Pay app, along with aggressive marketing, new whitepaper, and a new website, all coincide with the consolidation of the triangle.

免责声明
这些信息和出版物并非旨在提供,也不构成TradingView提供或认可的任何形式的财务、投资、交易或其他类型的建议或推荐。请阅读使用条款了解更多信息。