做多
MTL reversal
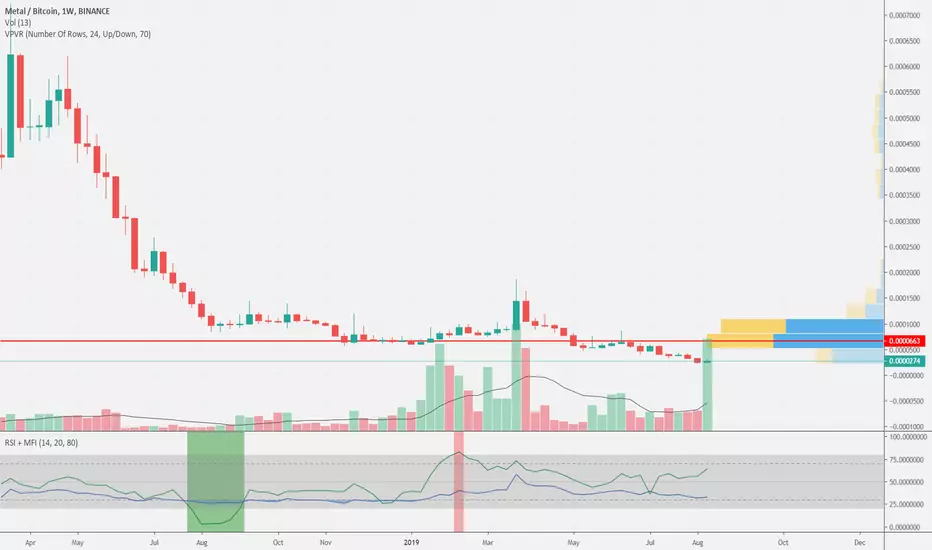
I will not draw anything (just hidden my drawings actually), as I need you to look at the volume and nothing else. This is week chart. The visible volume range bar red line (maximum density) is located around 650. MOre, if you zoom in, at 500-530. These are targets for the pump. Good luck =)
注释
Seems that Trading View doesn't remember the way I posted it with hidden drawings. Excuse me for that. Now it looks messy and nothing can be seen there. But its there, believe me =)
FREE telegram channels:
Main crypto channel - t.me/WiseAnalyze
Crypto chat - t.me/WiseAnalyzeChat
Crypto watchlist - t.me/wiseanalize
Main crypto channel - t.me/WiseAnalyze
Crypto chat - t.me/WiseAnalyzeChat
Crypto watchlist - t.me/wiseanalize
免责声明
这些信息和出版物并非旨在提供,也不构成TradingView提供或认可的任何形式的财务、投资、交易或其他类型的建议或推荐。请阅读使用条款了解更多信息。
FREE telegram channels:
Main crypto channel - t.me/WiseAnalyze
Crypto chat - t.me/WiseAnalyzeChat
Crypto watchlist - t.me/wiseanalize
Main crypto channel - t.me/WiseAnalyze
Crypto chat - t.me/WiseAnalyzeChat
Crypto watchlist - t.me/wiseanalize
免责声明
这些信息和出版物并非旨在提供,也不构成TradingView提供或认可的任何形式的财务、投资、交易或其他类型的建议或推荐。请阅读使用条款了解更多信息。