做多
Inverse H&S Forming On NANOUSD
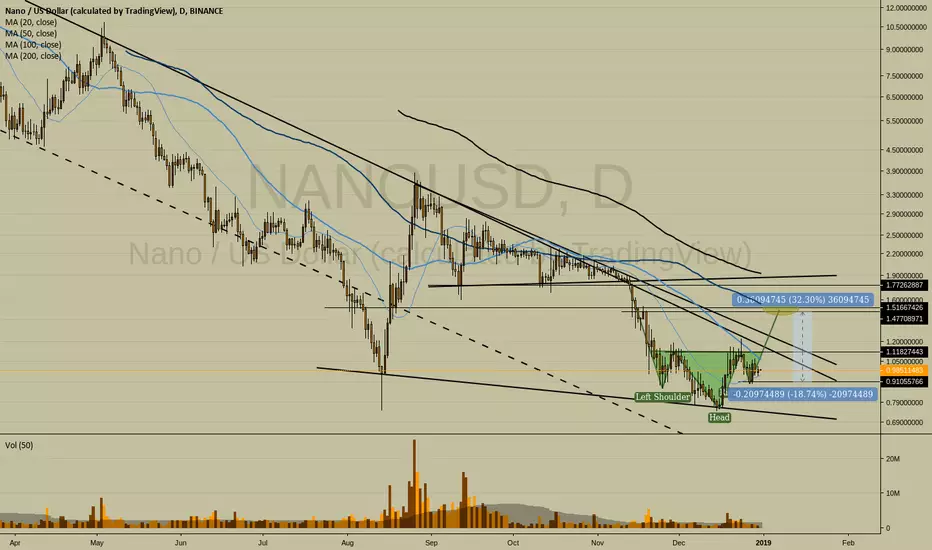
Hey everybody. Most cryptos are currently making an inverse head and shoulders pattern on the daily timeframe. Here I'm analyzing NANOUSD but I'll probably do a similar analysis on a more popular pair. If you have a suggestion let me know.
A head and shoulders pattern is an indication of a trend reversal. Here on NANOUSD you can see that the chart was making lower-lows, but on Dec 27 we made a bottom and failed to go lower than the previous bottom which was on Dec 15. This could be the first higher-low, and could indicate that Dec 15 was a long-term bottom.
Take note that there is major resistance above the neckline which could be one reason to avoid trading this. Personally I think that the inverse H&S could provide a lot of rocket fuel to break out of the descending wedge, which would lead to more buying and possibly a test of the 100 and 200 SMA. To me this seems like a good setup to break past resistance and reverse the trend.
You could trade this a few different ways. But whatever you do please make sure that your potential percentage gains are greater than your potential percentage losses.
That's all for now. I'm personally not planning on trading this, but I'll be watching to see how it plays out.
Please don't trade based on my technical analysis alone. This is only meant to provide you with new ideas and new insight to improve your own unique approach to trading. I don't expect to accurately predict what the price will do. I just enjoy imaging different scenarios that could happen. Enjoy!
If you appreciate the insight, let me know by leaving a thumbs up and following me.
Cheers!
A head and shoulders pattern is an indication of a trend reversal. Here on NANOUSD you can see that the chart was making lower-lows, but on Dec 27 we made a bottom and failed to go lower than the previous bottom which was on Dec 15. This could be the first higher-low, and could indicate that Dec 15 was a long-term bottom.
Take note that there is major resistance above the neckline which could be one reason to avoid trading this. Personally I think that the inverse H&S could provide a lot of rocket fuel to break out of the descending wedge, which would lead to more buying and possibly a test of the 100 and 200 SMA. To me this seems like a good setup to break past resistance and reverse the trend.
You could trade this a few different ways. But whatever you do please make sure that your potential percentage gains are greater than your potential percentage losses.
That's all for now. I'm personally not planning on trading this, but I'll be watching to see how it plays out.
Please don't trade based on my technical analysis alone. This is only meant to provide you with new ideas and new insight to improve your own unique approach to trading. I don't expect to accurately predict what the price will do. I just enjoy imaging different scenarios that could happen. Enjoy!
If you appreciate the insight, let me know by leaving a thumbs up and following me.
Cheers!

免责声明
这些信息和出版物并非旨在提供,也不构成TradingView提供或认可的任何形式的财务、投资、交易或其他类型的建议或推荐。请阅读使用条款了解更多信息。
免责声明
这些信息和出版物并非旨在提供,也不构成TradingView提供或认可的任何形式的财务、投资、交易或其他类型的建议或推荐。请阅读使用条款了解更多信息。