
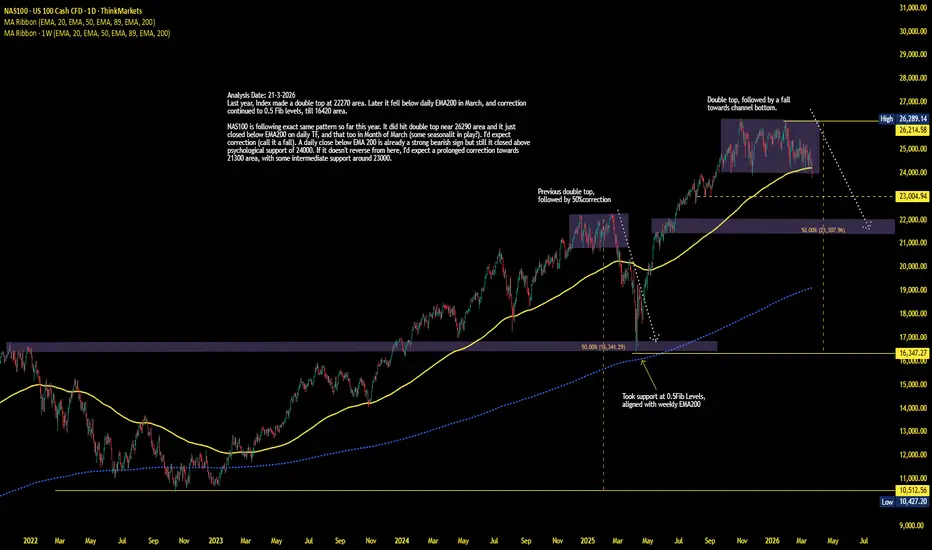
Last year, NAS100 made a double top around 22270 area. Later it fell below daily EMA200 in March, and correction continued to 0.5 Fib levels, till 16420 area.
NAS100 is following exact same pattern so far this year. It did hit double top near 26290 area and it just closed below EMA200 on daily TF, and that too in Month of March (some seasonality in play?). I'd expect correction (call it a fall). A daily close below EMA 200 is already a strong bearish sign but still it closed above psychological support of 24000. If it doesn't reverse from here, I'd expect a prolonged correction towards 21300 area (0.5Fib levels), with some intermediate support around 23000.
NAS100 is following exact same pattern so far this year. It did hit double top near 26290 area and it just closed below EMA200 on daily TF, and that too in Month of March (some seasonality in play?). I'd expect correction (call it a fall). A daily close below EMA 200 is already a strong bearish sign but still it closed above psychological support of 24000. If it doesn't reverse from here, I'd expect a prolonged correction towards 21300 area (0.5Fib levels), with some intermediate support around 23000.
交易开始
falling as expected, reaching first support zone near 23000.交易结束:到达目标
NASDAQ100 took support at 23000, and bounced.
📊 Charts → 🏗️ Structure → 🎯 Probability =📖 Chart Story
⏳ Patience → 🚀Success
🎯 If this setup makes sense to you, show it some support with a Boost.
⏳ Patience → 🚀Success
🎯 If this setup makes sense to you, show it some support with a Boost.
免责声明
这些信息和出版物并非旨在提供,也不构成TradingView提供或认可的任何形式的财务、投资、交易或其他类型的建议或推荐。请阅读使用条款了解更多信息。
📊 Charts → 🏗️ Structure → 🎯 Probability =📖 Chart Story
⏳ Patience → 🚀Success
🎯 If this setup makes sense to you, show it some support with a Boost.
⏳ Patience → 🚀Success
🎯 If this setup makes sense to you, show it some support with a Boost.
免责声明
这些信息和出版物并非旨在提供,也不构成TradingView提供或认可的任何形式的财务、投资、交易或其他类型的建议或推荐。请阅读使用条款了解更多信息。