
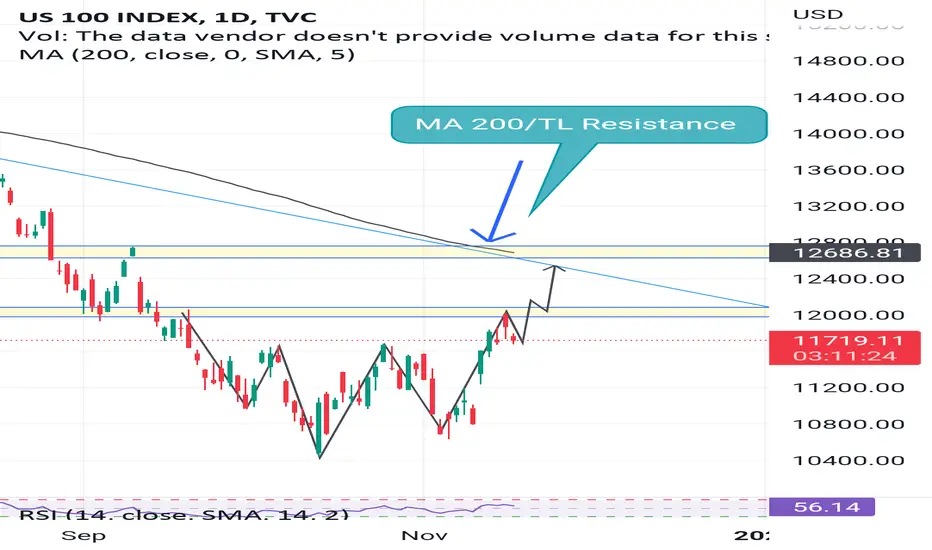
Nasdaq creating inverse head and shoulder pattern on daily chart and now testing the breakout neck line
It can easily go up to upper trendline and 200 Ma area which is also last high low were it has to chance to start fadingout as we are still in bear market 🐻
Micro bulish
Macro bearish
DYOR!
It can easily go up to upper trendline and 200 Ma area which is also last high low were it has to chance to start fadingout as we are still in bear market 🐻
Micro bulish
Macro bearish
DYOR!

免责声明
这些信息和出版物并非旨在提供,也不构成TradingView提供或认可的任何形式的财务、投资、交易或其他类型的建议或推荐。请阅读使用条款了解更多信息。