
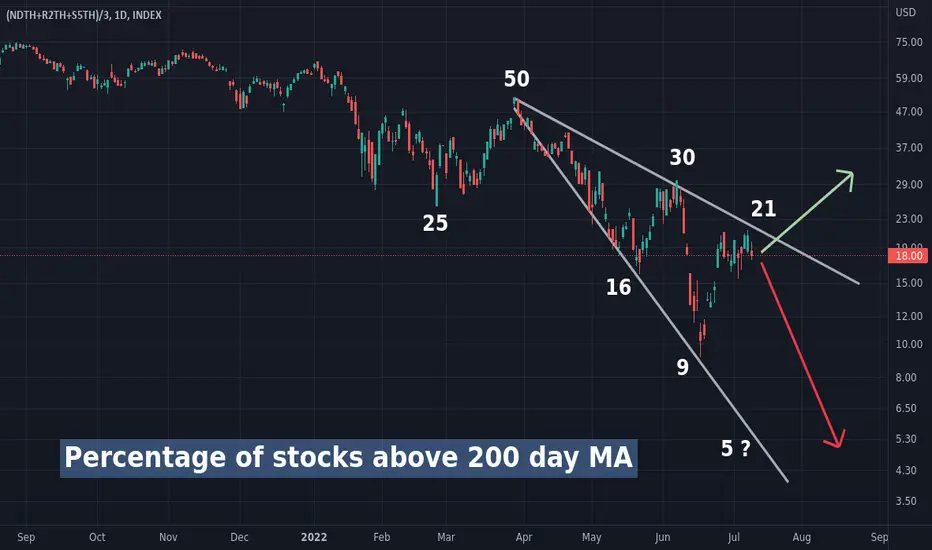
There's so much going on right now, but I think this chart sums it up for assets in general. This is a fairly simple idea I fantasized a while ago and it played out to my surprise. Every once and a while, the percentage of bullish stocks doubles, and then a selloff happens. Unless we can break this symmetry and make a clear break above 25, we should not expect anything special. It's easy to fomo in but possibly the best move is to move to other markets.
Also note the severity of the 2020 dump, before being launched by money supply expansion, among others:

We did not yet meet the level of the 2020 crash. Also, there is no money supply expansion this time. So, what would have happened in 2020 or perhaps 2008, should really happen this time, unless of course there is more money supply expansion.
Cheers and don't forget to hedge your bets!
Also note the severity of the 2020 dump, before being launched by money supply expansion, among others:
We did not yet meet the level of the 2020 crash. Also, there is no money supply expansion this time. So, what would have happened in 2020 or perhaps 2008, should really happen this time, unless of course there is more money supply expansion.
Cheers and don't forget to hedge your bets!
注释
Related idea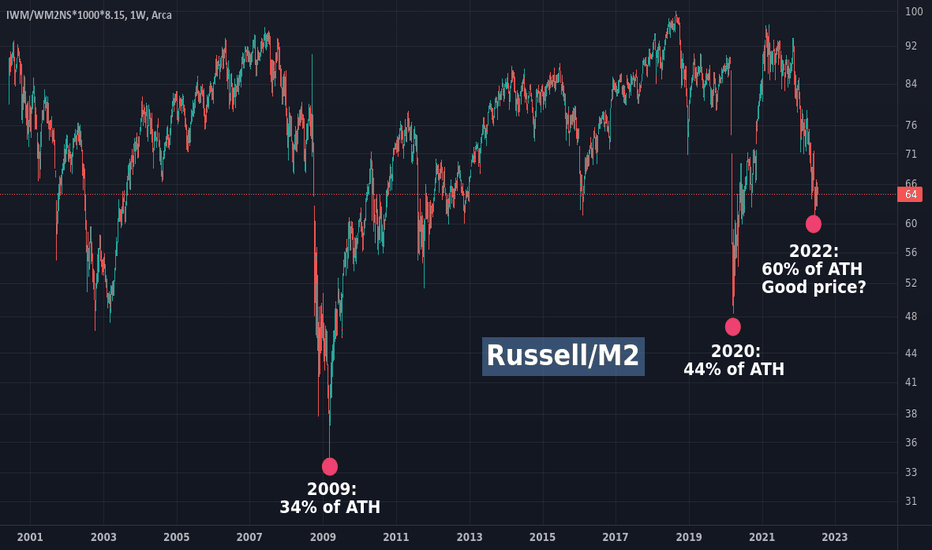
注释
DXY bearish break, SPY resistance break, I expect we will reach 25+within 1-2 weeks注释
25 was hit, we have a clear violation and sideways is trendy for now!
免责声明
这些信息和出版物并非旨在提供,也不构成TradingView提供或认可的任何形式的财务、投资、交易或其他类型的建议或推荐。请阅读使用条款了解更多信息。
免责声明
这些信息和出版物并非旨在提供,也不构成TradingView提供或认可的任何形式的财务、投资、交易或其他类型的建议或推荐。请阅读使用条款了解更多信息。