
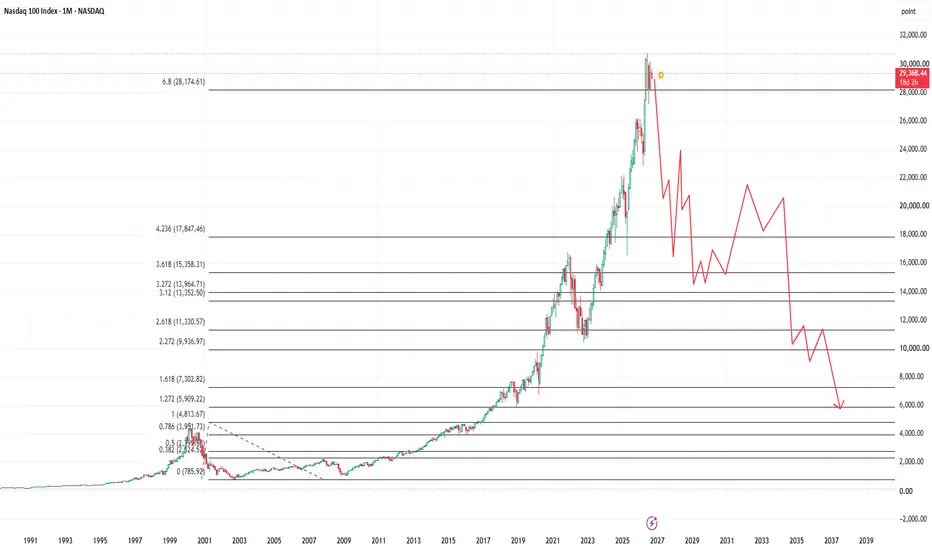
If you draw a fib from the high to the low of the 2000 Nasdaq crash you have the following;
2018 - 2019 Vol Panic = Traded 1.61 to 1.27.
2020 Covid Panic = Traded 2.20 - 1.61.
2022 Inflation Panic = Traded 3.60 - 2.61
2025 War Panic - Sharp retest of 4.23.
That means these fibs have bookended almost every major event in the last decade.
Now we are at the 6.8, which is a critical trend decision.
If this fails as support, we can see minimum of a 40% drop and significantly more if next supports break.
Conversely, if the 6.8 is used as support (or we fake out under it), an exceptional bull move would be likely to follow.
We are at the 6.8 extension of a 80% drop in an index. Where we have traded in a range for close to 6 months.
This is the first time that's happened in your lifetime.
Will probably never happen again in your lifetime.
2018 - 2019 Vol Panic = Traded 1.61 to 1.27.
2020 Covid Panic = Traded 2.20 - 1.61.
2022 Inflation Panic = Traded 3.60 - 2.61
2025 War Panic - Sharp retest of 4.23.
That means these fibs have bookended almost every major event in the last decade.
Now we are at the 6.8, which is a critical trend decision.
If this fails as support, we can see minimum of a 40% drop and significantly more if next supports break.
Conversely, if the 6.8 is used as support (or we fake out under it), an exceptional bull move would be likely to follow.
We are at the 6.8 extension of a 80% drop in an index. Where we have traded in a range for close to 6 months.
This is the first time that's happened in your lifetime.
Will probably never happen again in your lifetime.
交易开始
The only other instance of this in history was the 29 extensions, which was the 87 top. 
免责声明
这些信息和出版物并非旨在提供,也不构成TradingView提供或认可的任何形式的财务、投资、交易或其他类型的建议或推荐。请阅读使用条款了解更多信息。
免责声明
这些信息和出版物并非旨在提供,也不构成TradingView提供或认可的任何形式的财务、投资、交易或其他类型的建议或推荐。请阅读使用条款了解更多信息。