
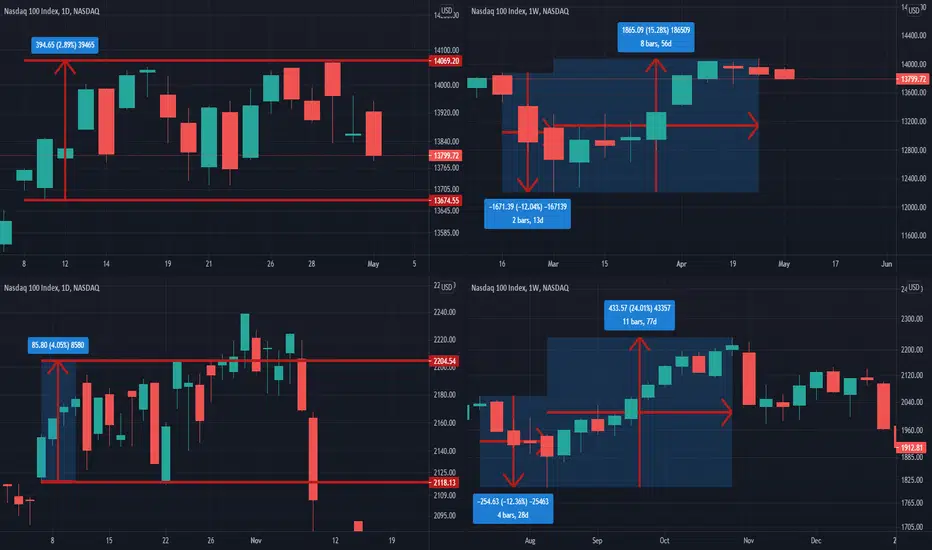
Above charts: daily chart since April 9th 2021and weekly chart since mid-February 2021.
Below cheats: daily chart since October 5th, 2007 and weekly chart since July 2007. (just before market crash)
I think these chart patterns have lots of similarities, you may argue that, but always it is better to be cautious.
If a similar scenario happening in the coming days, do you have a plan for that?
Below cheats: daily chart since October 5th, 2007 and weekly chart since July 2007. (just before market crash)
I think these chart patterns have lots of similarities, you may argue that, but always it is better to be cautious.
If a similar scenario happening in the coming days, do you have a plan for that?

Use the following link to access trading ideas: patreon.com/SniperTraderStocks?utm_medium=unknown&utm_source=join_link&utm_campaign=creatorshare_creator&utm_content=copyLink
免责声明
这些信息和出版物并非旨在提供,也不构成TradingView提供或认可的任何形式的财务、投资、交易或其他类型的建议或推荐。请阅读使用条款了解更多信息。
Use the following link to access trading ideas: patreon.com/SniperTraderStocks?utm_medium=unknown&utm_source=join_link&utm_campaign=creatorshare_creator&utm_content=copyLink
免责声明
这些信息和出版物并非旨在提供,也不构成TradingView提供或认可的任何形式的财务、投资、交易或其他类型的建议或推荐。请阅读使用条款了解更多信息。