
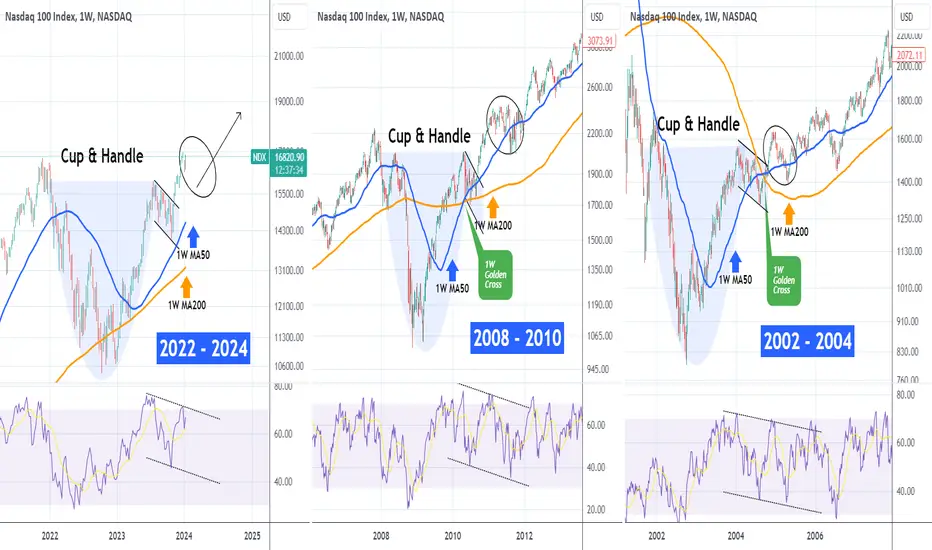
Nasdaq (NDX) has completed a giant Cup & Handle pattern and since the late October 2023 bottom, it has started the post Handle rally. This rally historically tends to be a very long-term one but with its fair share of corrections to at least the 1W MA50 (blue trend-line).
As you know 2022 was the year of the Inflation Crisis (left side of the Cup) while 2023 was its recovery (right side of Cup). Going back to the 2 most recent Bear Cycles, the 2008 Housing Crisis and 2002 Dotcom Crisis, we can observe similar Cup & Handle patterns, with identical 1W RSI sequences (oversold on their bottom and starting a Channel Down when the Handle begins).
The rally that followed after the Handle in 2011 and 2005 started another pull-back to the 1W MA50 (ellipse) just a few months after when the 1W RSI hit the top of its Channel Down. The chart shows that we might be in a similar situation right now. As a result, long-term investors may seek an additional buy entry as close to the 1W MA50 as possible like the late October bottom.
-------------------------------------------------------------------------------
** Please LIKE 👍, FOLLOW ✅, SHARE 🙌 and COMMENT ✍ if you enjoy this idea! Also share your ideas and charts in the comments section below! This is best way to keep it relevant, support us, keep the content here free and allow the idea to reach as many people as possible. **
-------------------------------------------------------------------------------
💸💸💸💸💸💸
👇 👇 👇 👇 👇 👇
As you know 2022 was the year of the Inflation Crisis (left side of the Cup) while 2023 was its recovery (right side of Cup). Going back to the 2 most recent Bear Cycles, the 2008 Housing Crisis and 2002 Dotcom Crisis, we can observe similar Cup & Handle patterns, with identical 1W RSI sequences (oversold on their bottom and starting a Channel Down when the Handle begins).
The rally that followed after the Handle in 2011 and 2005 started another pull-back to the 1W MA50 (ellipse) just a few months after when the 1W RSI hit the top of its Channel Down. The chart shows that we might be in a similar situation right now. As a result, long-term investors may seek an additional buy entry as close to the 1W MA50 as possible like the late October bottom.
-------------------------------------------------------------------------------
** Please LIKE 👍, FOLLOW ✅, SHARE 🙌 and COMMENT ✍ if you enjoy this idea! Also share your ideas and charts in the comments section below! This is best way to keep it relevant, support us, keep the content here free and allow the idea to reach as many people as possible. **
-------------------------------------------------------------------------------
💸💸💸💸💸💸
👇 👇 👇 👇 👇 👇

I trade Crypto, Forex, Indices & Commodities on PrimeXBT — all from one account with TradingView charts 👉 tradingshot.short.gy/PrimeXBT
I also use TradeNation for fixed spreads & zero commission 👉 tradingshot.short.gy/Tradenation
I also use TradeNation for fixed spreads & zero commission 👉 tradingshot.short.gy/Tradenation
免责声明
这些信息和出版物并非旨在提供,也不构成TradingView提供或认可的任何形式的财务、投资、交易或其他类型的建议或推荐。请阅读使用条款了解更多信息。
I trade Crypto, Forex, Indices & Commodities on PrimeXBT — all from one account with TradingView charts 👉 tradingshot.short.gy/PrimeXBT
I also use TradeNation for fixed spreads & zero commission 👉 tradingshot.short.gy/Tradenation
I also use TradeNation for fixed spreads & zero commission 👉 tradingshot.short.gy/Tradenation
免责声明
这些信息和出版物并非旨在提供,也不构成TradingView提供或认可的任何形式的财务、投资、交易或其他类型的建议或推荐。请阅读使用条款了解更多信息。