
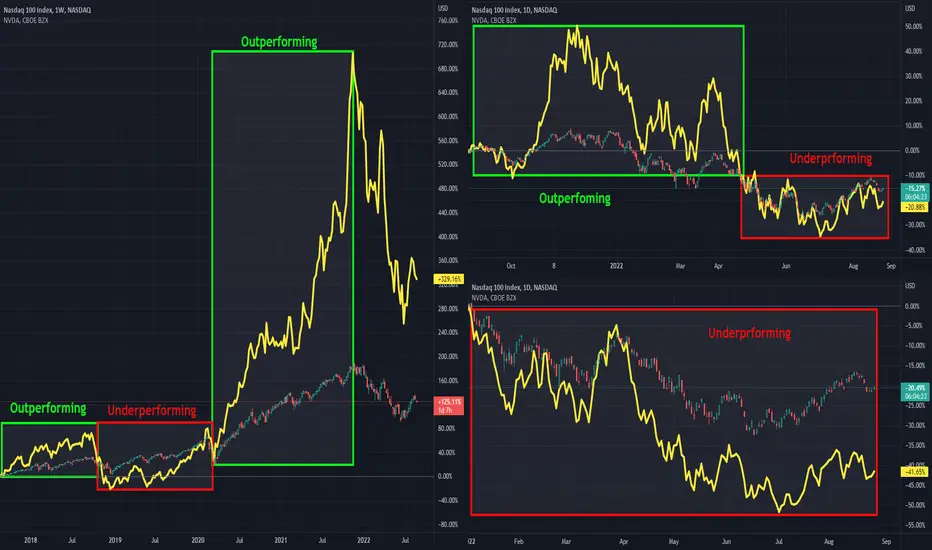
Wyckoff's stock selection process always included an analysis of comparative strength. To identify candidates for long positions, he looked for stocks or industries that were outperforming the market, both during trends and within trading ranges. In short positions, he looked for underperformers.
Therefore, he conducted his comparative strength analysis between a stock and the market, or between a stock and others in its industry.
Practical example: NASDAQ100 vs NVDA
5-year:

1-year:

YTD:

July-August 2022:

Conclusion: we can use outperforming stocks' charts with higher positive correlation as a leading indicator for Indexes!
Best,
Therefore, he conducted his comparative strength analysis between a stock and the market, or between a stock and others in its industry.
Practical example: NASDAQ100 vs NVDA
5-year:
1-year:
YTD:
July-August 2022:
Conclusion: we can use outperforming stocks' charts with higher positive correlation as a leading indicator for Indexes!
Best,

Use the following link to access trading ideas: patreon.com/SniperTraderStocks?utm_medium=unknown&utm_source=join_link&utm_campaign=creatorshare_creator&utm_content=copyLink
免责声明
这些信息和出版物并非旨在提供,也不构成TradingView提供或认可的任何形式的财务、投资、交易或其他类型的建议或推荐。请阅读使用条款了解更多信息。
Use the following link to access trading ideas: patreon.com/SniperTraderStocks?utm_medium=unknown&utm_source=join_link&utm_campaign=creatorshare_creator&utm_content=copyLink
免责声明
这些信息和出版物并非旨在提供,也不构成TradingView提供或认可的任何形式的财务、投资、交易或其他类型的建议或推荐。请阅读使用条款了解更多信息。