
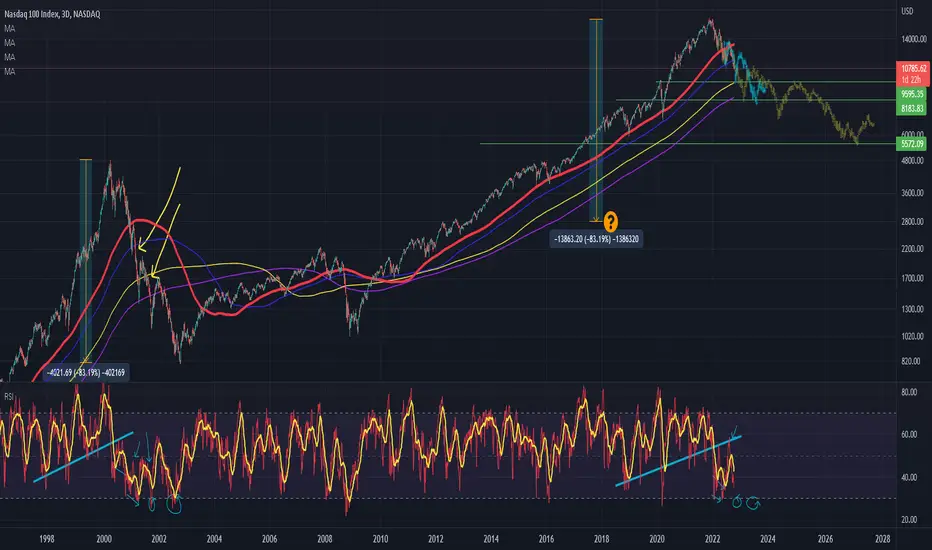
NASDAQ - Tech DEFLATION - dotcom crash repeat?
Pretty self explanatory. Can we compare the two periods? Well so far we sure as shit can.
Note the touches below 30 on the RSI during that period. We have not had enough touches below 30 yet.
The fractal can be looked at in two ways as I see it. Both are on there. IMO blue is more likely as we have been going down for awhile and it would make a bit more sense time line wise. But who tf knows.
Its a good idea to have these maps imo to keep your senses about you. ie. to remind you how far this thing COULD drop. People around you will be calling bottoms all the way down, with each one falling like dominoes.
Remember the exuberance during the bull, how the top just keeps topping, well that's this, in reverse. Don't underestimate it either way, it always (almost always) goes harder (not bitcoin this last time) than you think.
Lets see how this shit show plays out.
gl
注释
actually yellow makes just as much sense, timeline wise. rsi wise the yellow makes more sense to me.
免责声明
这些信息和出版物并非旨在提供,也不构成TradingView提供或认可的任何形式的财务、投资、交易或其他类型的建议或推荐。请阅读使用条款了解更多信息。