
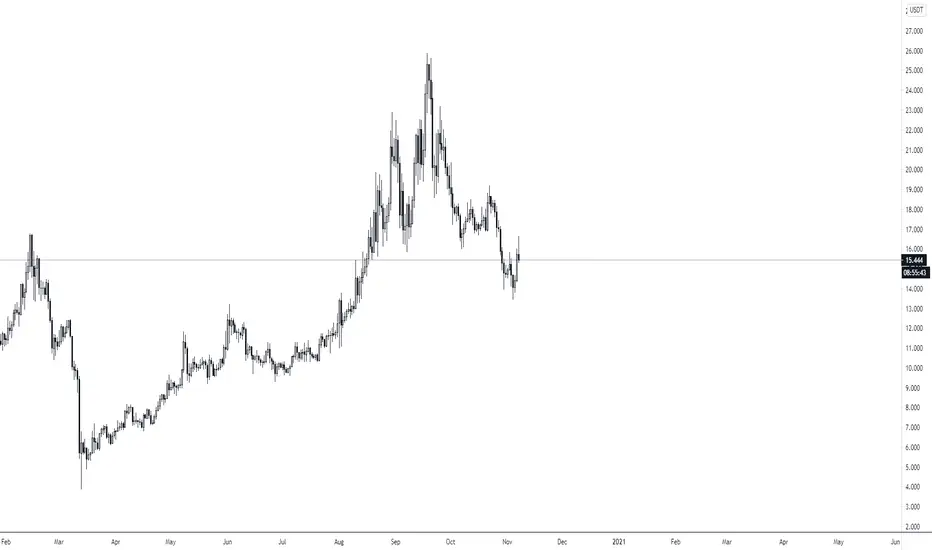
TOP DOWN ANALYSIS ON NEOUSDT
注释
On the daily timeframe, market has been on a strong bullish run since March till date. Again, we can also see two respected support and resistance zones accompanied by a head and shoulder formation which price had broken the neckline and currently in for a retest.
注释
On a 4 hour timeframe, we can spot the down trending channel. The small red zone that has been marked out is an obvious fake out. Price is currently at resistance of the channel which is also the confirmed resistance zone.
注释
Evidences on daily and 4 hour timeframe proves that the odds that the market will be bearish on a long term is much higher. However, it is very important to make sure you manage your risks on whatever trading decisions you intent to make with live funds.
免责声明
这些信息和出版物并非旨在提供,也不构成TradingView提供或认可的任何形式的财务、投资、交易或其他类型的建议或推荐。请阅读使用条款了解更多信息。