
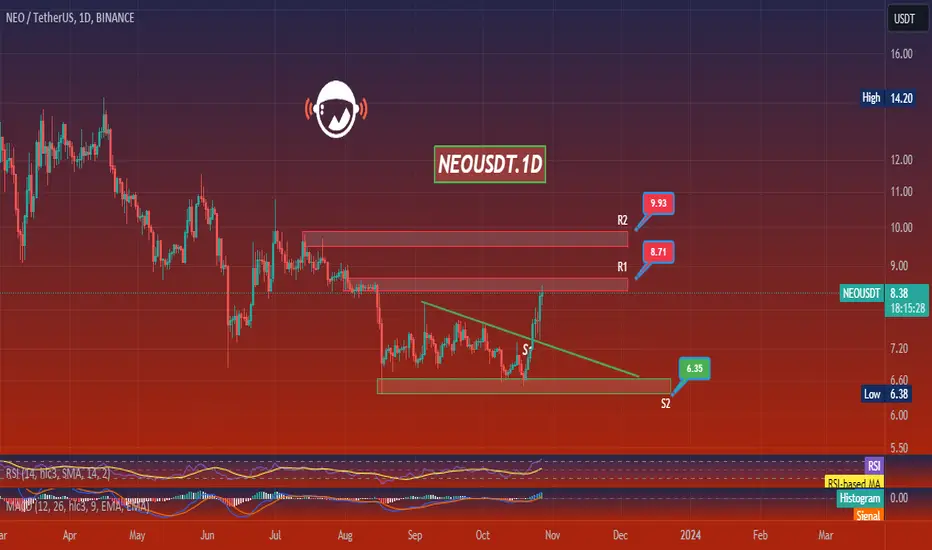
Based on the provided market data, the NEO/USDT pair is currently trading at $8.34. The pair has a 4-hour RSI of 74.69 and a daily RSI of 74.14, indicating that it is in the overbought territory and may see some pullback. The MACD on the 4-hour and daily timeframes are both positive, suggesting an ongoing bullish trend.
However, the 7-day RSI is at 47.38, which is near the middle of the range, suggesting a neutral longer-term outlook. The 7-day MACD is negative, which could indicate a bearish trend over the past week.
In terms of support and resistance levels, the 4-hour chart shows resistance at $8.67, $9.22, and $9.58, and support at $7.67, $6.47, and $6.30. The daily chart shows resistance at $8.73, $9.94, and $10.50, and support at $7.07, $6.50, and $5.78. The 7-day chart shows resistance at $8.48, $11.59, and $15.50, and support at $6.34, $5.92, and $5.44.
In conclusion, while the short-term trend for NEO/USDT appears bullish, the market data suggests that the pair is currently overbought and may see some pullback. The longer-term outlook is more neutral to bearish. Traders should keep an eye on the support and resistance levels, as well as the RSI and MACD for signs of potential trend reversals. As always, it's important to combine this technical analysis with other market indicators and news events before making any trading decisions.

免责声明
这些信息和出版物并非旨在提供,也不构成TradingView提供或认可的任何形式的财务、投资、交易或其他类型的建议或推荐。请阅读使用条款了解更多信息。
免责声明
这些信息和出版物并非旨在提供,也不构成TradingView提供或认可的任何形式的财务、投资、交易或其他类型的建议或推荐。请阅读使用条款了解更多信息。