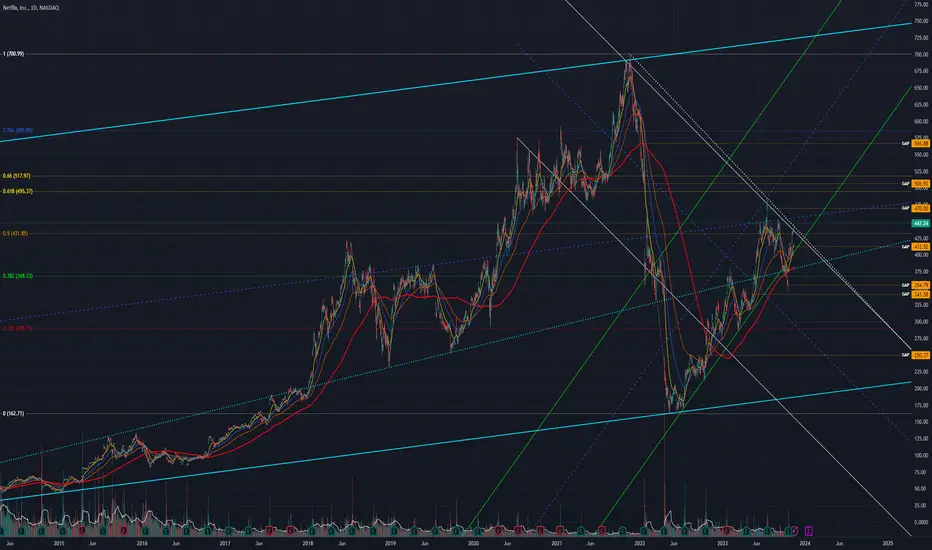
 NFLX chart mapping/analysis.
Bullish recovery back into ascending parallel channel (green).
Bull target(s)
- Breakout descending parallel channel (white) + descending trend-line confluence resistance
- Overhead gap fills (~470 / ~506.93 / ~566.88)
- Golden Pocket Fib + gap fill (~506.93) confluence resistance zone
Bear target(s)
- Underlying gap fills (~412.52 / ~354.79 / ~341.38)
- Ascending trend-line support (light blue dotted)
- 38.2% Fib
- 23.6% Fib
注释
Note: TradingView chart was dividend adjusted (ADJ) when mapped.注释
NFLX strong bullish momentum into ~480 overhead supply zone.Could see consolidation before EOY surge towards Golden Pocket Fib/~500 psychological level, otherwise sellers retake control & stage a bearish mean reversion, TBC.

相关出版物
免责声明
这些信息和出版物并非旨在提供,也不构成TradingView提供或认可的任何形式的财务、投资、交易或其他类型的建议或推荐。请阅读使用条款了解更多信息。