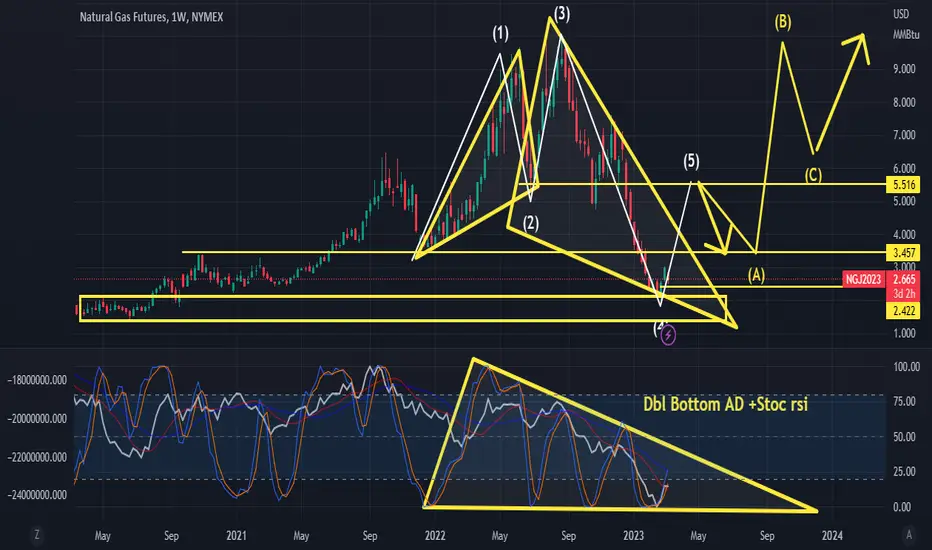
natty weekly chart both AD/Stoch RSI double bottom
385
including the wave count, Im showing a retest of the b leg of the bullish cypher which is around wave 2... Im buying all dips on natural gas and boil etf
注释
this is the daily chart of natural gas. Notice there is a triple bottom by the AD+price Action+ichomoku Cloud (bullish) And the AD is heading towards the .236 fib level on the daily chart. Bullish Cypher set up. My Daily Time Frame target for natural gas is $5.28.. Buy the Dips BOILKOLD