
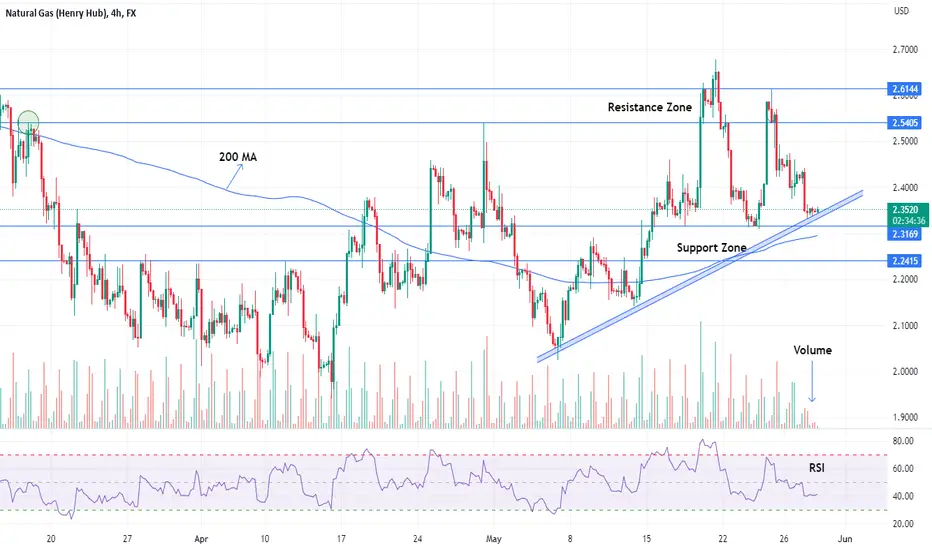
The NATURAL GAS trend is bearish for the last couple of months. The market placed a 1.9625 low on 22-Feb-2023. In a 4Hour time frame market reject the resistance area ( $2.54-2.61 ) as mentioned in the price chart and continued the bearish move. Now price is traded near the Support area ( $2.31-2.24 ). Volume indicates bears lose momentum. Price respect the Trendline in the past two times and now again near to test. Price also traded above the 200 MA ( moving average ) which indicates a bullish trend. So initiate long positions after closing above the Support area and also the trendline. On the other side, Short selling is favorable near the resistance area as mentioned above in the price chart after confirmation by a bearish price action structure.
Support and Resistance levels for day trading ;
Pivot Point Level: PP 2.3776
Support Levels: S1 2.3137, S2 2.2684, S3 2.2045
Resistance Levels: R1 2.4229, R2 2.4868, R3 2.5321
Support and Resistance levels for day trading ;
Pivot Point Level: PP 2.3776
Support Levels: S1 2.3137, S2 2.2684, S3 2.2045
Resistance Levels: R1 2.4229, R2 2.4868, R3 2.5321

免责声明
这些信息和出版物并非旨在提供,也不构成TradingView提供或认可的任何形式的财务、投资、交易或其他类型的建议或推荐。请阅读使用条款了解更多信息。
免责声明
这些信息和出版物并非旨在提供,也不构成TradingView提供或认可的任何形式的财务、投资、交易或其他类型的建议或推荐。请阅读使用条款了解更多信息。