
Dear trader,
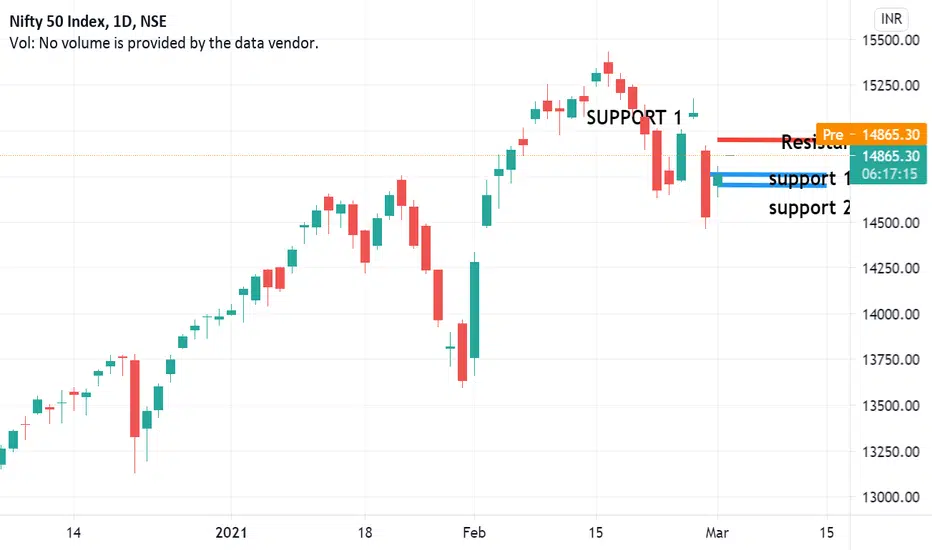
If u look at the chart of HDFC LIFE (analysis based intraday only) the HDFC support 1 at 14760 and support 2 at 14700 and resistance at 14950.
The chart clearly indicates Bullish Trend you can also see the candle stick patters for more in depth analysis.
In Intraday most important thing is to enter and exit points.
Our signals are based on analytics, algorithms, mathematical derivatives.
Always be a responsible trader, kindly trade only when you have maximum opportunity in the market with minimum risk and with keynotes like data, analysis and proper strategies.
Kindly message us for strategies and analysis.
If u look at the chart of HDFC LIFE (analysis based intraday only) the HDFC support 1 at 14760 and support 2 at 14700 and resistance at 14950.
The chart clearly indicates Bullish Trend you can also see the candle stick patters for more in depth analysis.
In Intraday most important thing is to enter and exit points.
Our signals are based on analytics, algorithms, mathematical derivatives.
Always be a responsible trader, kindly trade only when you have maximum opportunity in the market with minimum risk and with keynotes like data, analysis and proper strategies.
Kindly message us for strategies and analysis.

免责声明
这些信息和出版物并非旨在提供,也不构成TradingView提供或认可的任何形式的财务、投资、交易或其他类型的建议或推荐。请阅读使用条款了解更多信息。
免责声明
这些信息和出版物并非旨在提供,也不构成TradingView提供或认可的任何形式的财务、投资、交易或其他类型的建议或推荐。请阅读使用条款了解更多信息。