
Hello Traders,
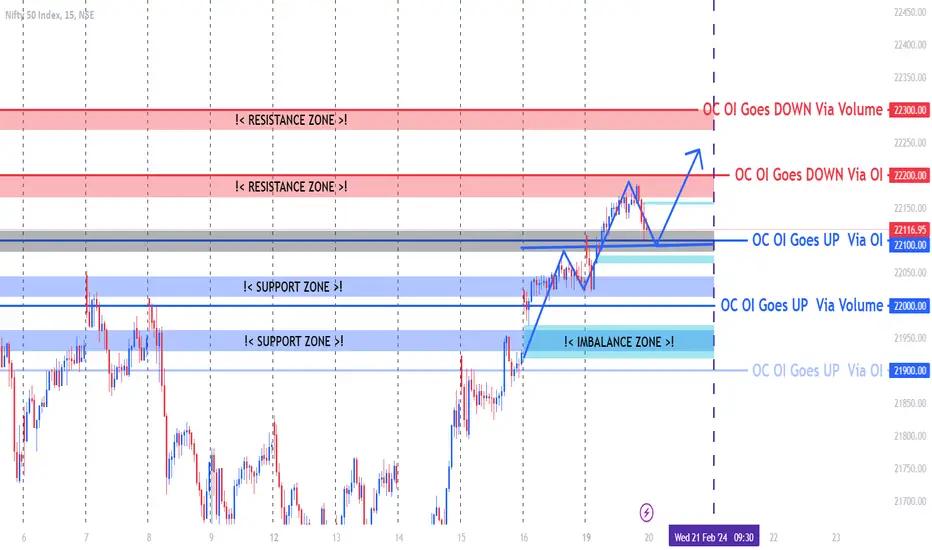
Here is a Brief Overview About The Analysis of NIFTY 50 For Feb 20th,
There Are Total of 2 Support Zones Which You Need To Look For And Same 2 Resistance Zones And To Be Mentioned One Grey Area And We Have 3 Imbalance Zones!
The Horizontal Lines From Volume To Volume And OI To OI Indicates The Market Range in Between For That Particular Day!
The Blue And Red Arrow Path Showing The Direction of The NIFTY 50 For Tomorrow.
Note : Those Levels Are Only For That Particular Day.
Please Note That The Only Purpose of The Information On This Page is Purely Educational.
We Are Not Registered with SEBI; Therefore, Before Making Any Financial Decisions OR Investing, Please Consult with A SEBI-Qualified Financial Advisor. We Don't Have Any Responsibility For Your Profits OR Losses.
I Would Welcome Your Participation And Support in the Form of Likes, Comments, And Follow us to Offer Some Encouragement.
Thank You.
Here is a Brief Overview About The Analysis of NIFTY 50 For Feb 20th,
There Are Total of 2 Support Zones Which You Need To Look For And Same 2 Resistance Zones And To Be Mentioned One Grey Area And We Have 3 Imbalance Zones!
The Horizontal Lines From Volume To Volume And OI To OI Indicates The Market Range in Between For That Particular Day!
The Blue And Red Arrow Path Showing The Direction of The NIFTY 50 For Tomorrow.
Note : Those Levels Are Only For That Particular Day.
Please Note That The Only Purpose of The Information On This Page is Purely Educational.
We Are Not Registered with SEBI; Therefore, Before Making Any Financial Decisions OR Investing, Please Consult with A SEBI-Qualified Financial Advisor. We Don't Have Any Responsibility For Your Profits OR Losses.
I Would Welcome Your Participation And Support in the Form of Likes, Comments, And Follow us to Offer Some Encouragement.
Thank You.
交易结束:到达目标

相关出版物
免责声明
这些信息和出版物并非旨在提供,也不构成TradingView提供或认可的任何形式的财务、投资、交易或其他类型的建议或推荐。请阅读使用条款了解更多信息。