
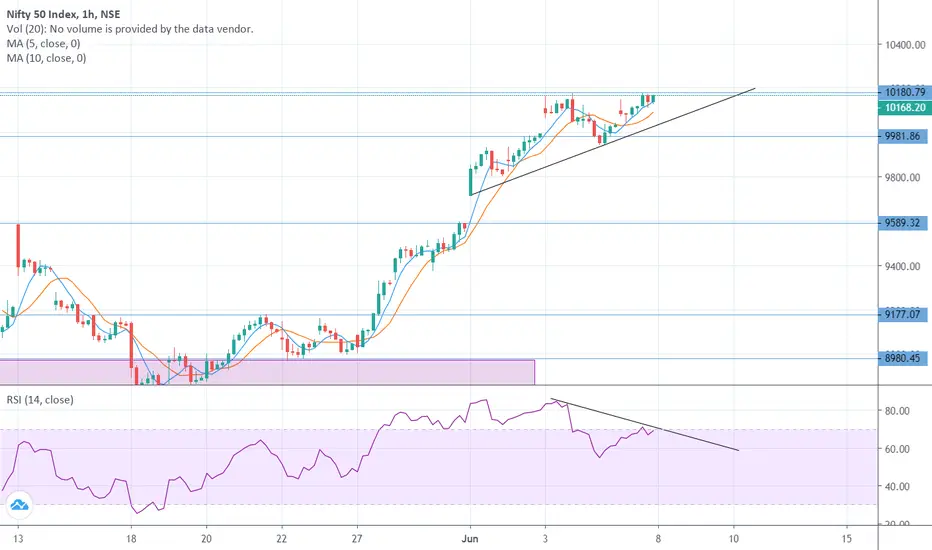
From the hourly chart of Nifty 50, we can clearly see it is making double top pattern, which is a indication of trend reversal. Also, RSI is showing negative divergence which implies that the Nifty can slide down. Nifty is at strong resistance level. We have to keep checking how it behaves on Monday, and with the confirmation of trend reversal we can short for good profits.
Shorting after the trend line (shown in image) breaks will be a good opportunity. Keep an eye on it on Monday 8th of June 2020.
Shorting after the trend line (shown in image) breaks will be a good opportunity. Keep an eye on it on Monday 8th of June 2020.
注释
Also, Nifty can make Double top pattern.
免责声明
这些信息和出版物并非旨在提供,也不构成TradingView提供或认可的任何形式的财务、投资、交易或其他类型的建议或推荐。请阅读使用条款了解更多信息。
免责声明
这些信息和出版物并非旨在提供,也不构成TradingView提供或认可的任何形式的财务、投资、交易或其他类型的建议或推荐。请阅读使用条款了解更多信息。