
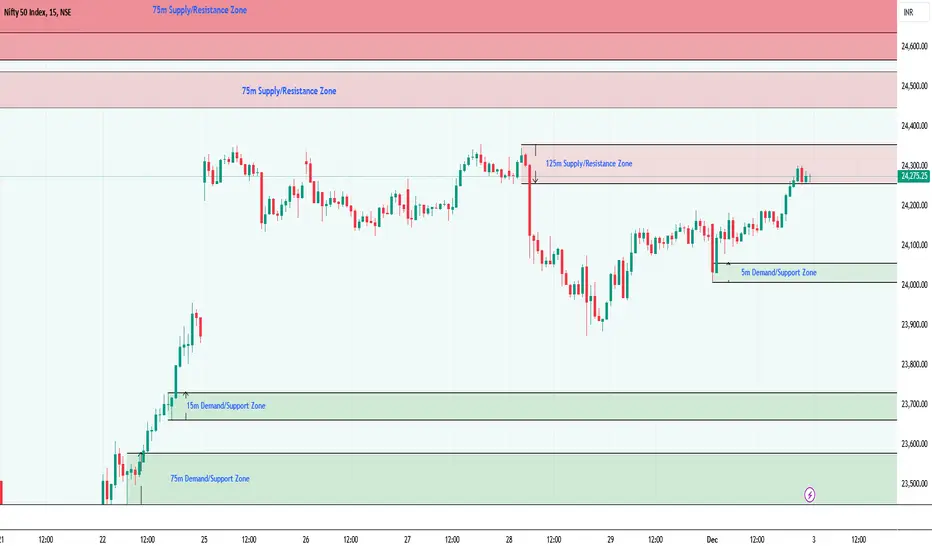
On Monday, Nifty opened flat, made a low of 24008.65, and rallied to a day high of 24301.70, entering the 125m supply zone. It closed at 24276.05, gaining 145 points over the previous close. Both the Weekly Trend (50 SMA) and Daily Trend (50 SMA) remain sideways, indicating range-bound movement.
Demand/Support Zones
Near Demand/Support Zone (5m): 24008.65 - 24056.85
Near Demand/Support Zone (15m): 23661.75 - 23731.25
Far Demand/Support Zone (75m): 23447.15 - 23578.60
Far Support: 23189.88 (61.8% FIBO)
Far Demand/Support Zone (Daily): 22642.60 - 22910.15
Supply/Resistance Zones
Near Supply/Resistance Zone (125m): 24257.65 - 24354.55 (current price inside the zone)
Far Supply/Resistance Zone (75m): 24447.65 - 24537.60
Far Supply/Resistance Zone (Daily): 24567.65 - 24978.30 (inside weekly supply)
Far Supply/Resistance Zone (75m): 24636.75 - 24741.45 (inside daily supply)
Far Supply/Resistance Zone (Weekly): 24567.65 - 25234.05
Demand/Support Zones
Near Demand/Support Zone (5m): 24008.65 - 24056.85
Near Demand/Support Zone (15m): 23661.75 - 23731.25
Far Demand/Support Zone (75m): 23447.15 - 23578.60
Far Support: 23189.88 (61.8% FIBO)
Far Demand/Support Zone (Daily): 22642.60 - 22910.15
Supply/Resistance Zones
Near Supply/Resistance Zone (125m): 24257.65 - 24354.55 (current price inside the zone)
Far Supply/Resistance Zone (75m): 24447.65 - 24537.60
Far Supply/Resistance Zone (Daily): 24567.65 - 24978.30 (inside weekly supply)
Far Supply/Resistance Zone (75m): 24636.75 - 24741.45 (inside daily supply)
Far Supply/Resistance Zone (Weekly): 24567.65 - 25234.05

免责声明
这些信息和出版物并非旨在提供,也不构成TradingView提供或认可的任何形式的财务、投资、交易或其他类型的建议或推荐。请阅读使用条款了解更多信息。