
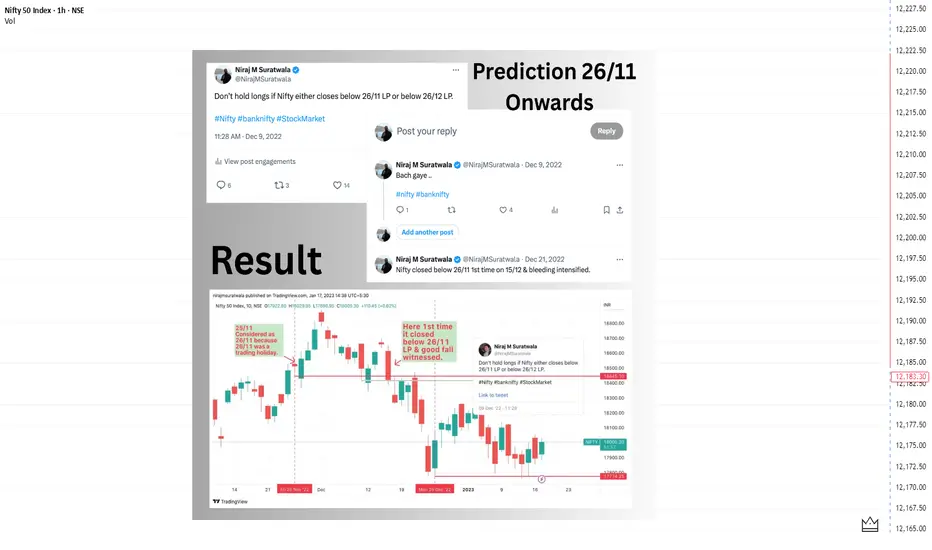
(26 Nov 2022 Reference | WD Gann Framework)
This idea presents a historical study of how time-based pressure zones can interact with important price levels, using concepts derived from WD Gann methodology.
⚠️ This is not a trading signal or forecast.
It is shared purely for educational and structural study purposes.
📌 Study Background
In late November 2022, NIFTY was trading near an important reference low formed around 26 November.
This study observes how markets often respond when time alignment and price structure intersect.
📊 What the Chart Shows
🧠 Key Learning Takeaways
⚠️ Disclaimer
This content is for educational and research purposes only.
It does not constitute financial advice or market recommendations.
This idea presents a historical study of how time-based pressure zones can interact with important price levels, using concepts derived from WD Gann methodology.
⚠️ This is not a trading signal or forecast.
It is shared purely for educational and structural study purposes.
📌 Study Background
In late November 2022, NIFTY was trading near an important reference low formed around 26 November.
This study observes how markets often respond when time alignment and price structure intersect.
📊 What the Chart Shows
- A clearly defined reference price zone
- Subsequent increase in volatility once price closed below that zone
- Expansion in directional movement after time–price imbalance
- How pressure zones often act as decision points, not guarantees
🧠 Key Learning Takeaways
- Time-based levels often define risk zones, not direction
- Price behavior changes when pressure builds near reference dates
- WD Gann analysis focuses on structure and balance
- Studying past cycles helps traders understand market behavior, not predict outcomes
⚠️ Disclaimer
This content is for educational and research purposes only.
It does not constitute financial advice or market recommendations.

相关出版物
免责声明
这些信息和出版物并非旨在提供,也不构成TradingView提供或认可的任何形式的财务、投资、交易或其他类型的建议或推荐。请阅读使用条款了解更多信息。