
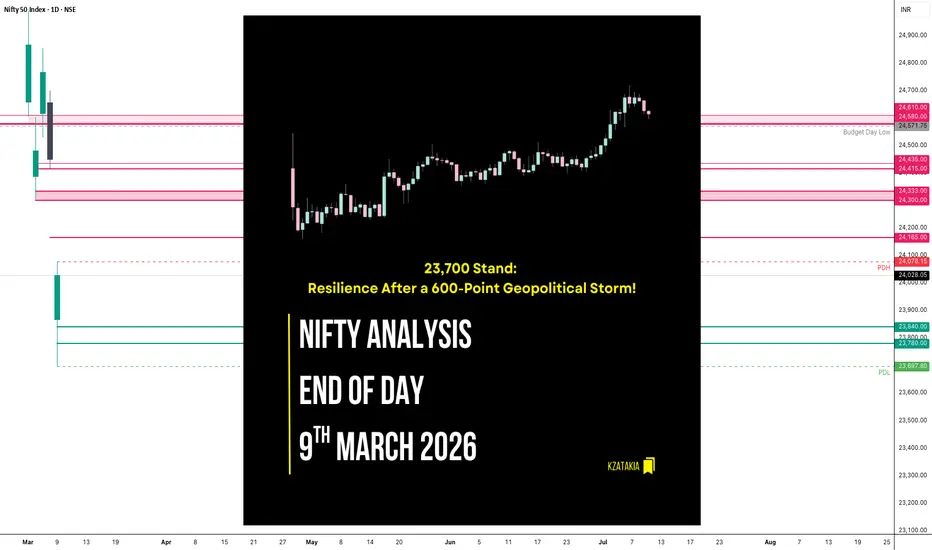
🟢 Nifty Analysis EOD – March 9, 2026 – Monday 🔴
23,700 Stand: Resilience After a 600-Point Geopolitical Storm!
🗞 Nifty Summary
Driven by negative global sentiment, geopolitical turmoil, and a surge in crude prices, the Nifty faced a staggering 600-point Gap Down today. The initial minutes saw an 88-point recovery attempt, but the pressure was too great, causing a deep 262-point plunge from the morning high to mark a day low at 23,697.80 (23,700).
This level acted as a rock-solid floor. From here, Nifty began a slow, steady, and disciplined climb toward the Initial Balance High (IBH). After multiple failed attempts to break the ceiling, the bulls finally succeeded around 2:40 PM, reclaiming the day high at 24,078.
The index eventually ended the session at 24,007.60 (Adjusted close: 24,028.05), losing -422.40 points (-1.73%). While the net change remains deeply in the red, the intraday structure tells a story of extreme resilience, with bulls absorbing a massive amount of selling pressure from the morning lows.
The volatility was mirrored in the oil markets; Brent Crude hit a high of 113.73 before losing 10 dollars mid-session. This kind of wild reaction is likely to persist in our markets for the upcoming sessions.
On the Daily time frame, despite the gap, we see a strong bullish recovery body, suggesting that buyers are finding value even in this environment of fear.
🛡 5 Min Intraday Chart with Levels

📉 Daily Time Frame Chart with Intraday Levels

🕯 Daily Candle Breakdown
Open: 23,868.05
High: 24,078.15
Low: 23,697.80
Close: 24,028.05
Change: -422.40 (-1.73%)
🏗️ Structure Breakdown
Type: Strong Bullish Candle (Intraday Recovery).
Range: ≈ 380 points — Very high volatility.
Body: ≈ 160 points — Solid bullish real body after the open.
Upper Wick: ≈ 50 points — Minor resistance encountered near the day’s peak.
Lower Wick: ≈ 170 points — Aggressive buying rejection from the 23,700 base.
🛡 5 Min Intraday Chart

⚔️ Gladiator Strategy Update
ATR: 386.38
IB Range: 261.90 → Medium (Relative to current volatility)
Market Structure: Imbalanced
Trade Highlights:
No Trade Day
Trade Summary: I chose to stay away from the trade terminal and be a spectator today. The combination of a massive opening gap and extreme geopolitical uncertainty made the directional bias very low-conviction. As a conservative trader, I prefer capital protection over chasing wild moves. When stop-losses are 2-3x wider than normal due to high ATR, even a winning trade can be stressful. Technical analysis is often less effective when a single headline or tweet can override every support and resistance level.
🧱 Support & Resistance Levels
Resistance Zones: 24,080 | 24,165 | 24,300 ~ 24,333
Support Zones: 23,840 | 23,780 | 23,700 (New Floor)
🧠 Final Thoughts
“Protecting capital is the only trade worth making in a war zone.”
With weekly expiry approaching and no signs of peace on the war front, I have decided to avoid trading for the next few sessions.
The market is currently a battlefield of news rather than numbers. I’m not looking to get rich quick; I’m looking to ensure I have capital left when the dust finally settles. Let the market find a new equilibrium before resuming Trading.
✏️ Disclaimer
This is my personal digital diary and represents my own analysis and point of view. It is not financial advice; please consult a professional advisor before making any trading decisions.
23,700 Stand: Resilience After a 600-Point Geopolitical Storm!
🗞 Nifty Summary
Driven by negative global sentiment, geopolitical turmoil, and a surge in crude prices, the Nifty faced a staggering 600-point Gap Down today. The initial minutes saw an 88-point recovery attempt, but the pressure was too great, causing a deep 262-point plunge from the morning high to mark a day low at 23,697.80 (23,700).
This level acted as a rock-solid floor. From here, Nifty began a slow, steady, and disciplined climb toward the Initial Balance High (IBH). After multiple failed attempts to break the ceiling, the bulls finally succeeded around 2:40 PM, reclaiming the day high at 24,078.
The index eventually ended the session at 24,007.60 (Adjusted close: 24,028.05), losing -422.40 points (-1.73%). While the net change remains deeply in the red, the intraday structure tells a story of extreme resilience, with bulls absorbing a massive amount of selling pressure from the morning lows.
The volatility was mirrored in the oil markets; Brent Crude hit a high of 113.73 before losing 10 dollars mid-session. This kind of wild reaction is likely to persist in our markets for the upcoming sessions.
On the Daily time frame, despite the gap, we see a strong bullish recovery body, suggesting that buyers are finding value even in this environment of fear.
🛡 5 Min Intraday Chart with Levels
📉 Daily Time Frame Chart with Intraday Levels
🕯 Daily Candle Breakdown
Open: 23,868.05
High: 24,078.15
Low: 23,697.80
Close: 24,028.05
Change: -422.40 (-1.73%)
🏗️ Structure Breakdown
Type: Strong Bullish Candle (Intraday Recovery).
Range: ≈ 380 points — Very high volatility.
Body: ≈ 160 points — Solid bullish real body after the open.
Upper Wick: ≈ 50 points — Minor resistance encountered near the day’s peak.
Lower Wick: ≈ 170 points — Aggressive buying rejection from the 23,700 base.
🛡 5 Min Intraday Chart
⚔️ Gladiator Strategy Update
ATR: 386.38
IB Range: 261.90 → Medium (Relative to current volatility)
Market Structure: Imbalanced
Trade Highlights:
No Trade Day
Trade Summary: I chose to stay away from the trade terminal and be a spectator today. The combination of a massive opening gap and extreme geopolitical uncertainty made the directional bias very low-conviction. As a conservative trader, I prefer capital protection over chasing wild moves. When stop-losses are 2-3x wider than normal due to high ATR, even a winning trade can be stressful. Technical analysis is often less effective when a single headline or tweet can override every support and resistance level.
🧱 Support & Resistance Levels
Resistance Zones: 24,080 | 24,165 | 24,300 ~ 24,333
Support Zones: 23,840 | 23,780 | 23,700 (New Floor)
🧠 Final Thoughts
“Protecting capital is the only trade worth making in a war zone.”
With weekly expiry approaching and no signs of peace on the war front, I have decided to avoid trading for the next few sessions.
The market is currently a battlefield of news rather than numbers. I’m not looking to get rich quick; I’m looking to ensure I have capital left when the dust finally settles. Let the market find a new equilibrium before resuming Trading.
✏️ Disclaimer
This is my personal digital diary and represents my own analysis and point of view. It is not financial advice; please consult a professional advisor before making any trading decisions.

Read my blogs here:
substack.com/@kzatakia
Follow me on Telegram:
t.me/swingtraderhub
Follow me on X:
x.com/kzatakia
substack.com/@kzatakia
Follow me on Telegram:
t.me/swingtraderhub
Follow me on X:
x.com/kzatakia
相关出版物
免责声明
这些信息和出版物并非旨在提供,也不构成TradingView提供或认可的任何形式的财务、投资、交易或其他类型的建议或推荐。请阅读使用条款了解更多信息。
Read my blogs here:
substack.com/@kzatakia
Follow me on Telegram:
t.me/swingtraderhub
Follow me on X:
x.com/kzatakia
substack.com/@kzatakia
Follow me on Telegram:
t.me/swingtraderhub
Follow me on X:
x.com/kzatakia
相关出版物
免责声明
这些信息和出版物并非旨在提供,也不构成TradingView提供或认可的任何形式的财务、投资、交易或其他类型的建议或推荐。请阅读使用条款了解更多信息。