
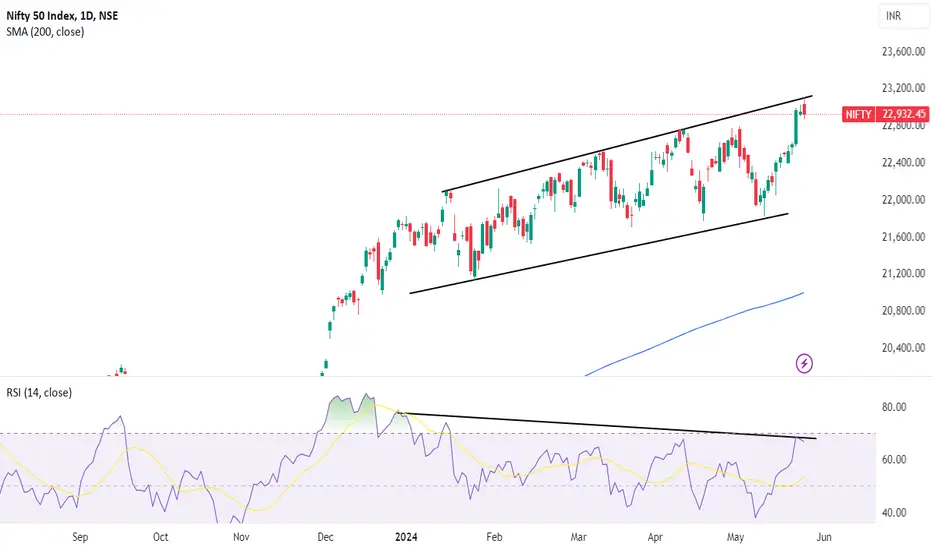
Also there is a formation Bearish RSI Divergence daily chart. On 15 January index reached a high of 22115 and the RSI value was at 74 today index reached a new high of 23043 but the RSI was at 67 this is a clear formation of RSI divergence.
注释
today it really down注释
🤕
免责声明
这些信息和出版物并非旨在提供,也不构成TradingView提供或认可的任何形式的财务、投资、交易或其他类型的建议或推荐。请阅读使用条款了解更多信息。
免责声明
这些信息和出版物并非旨在提供,也不构成TradingView提供或认可的任何形式的财务、投资、交易或其他类型的建议或推荐。请阅读使用条款了解更多信息。