
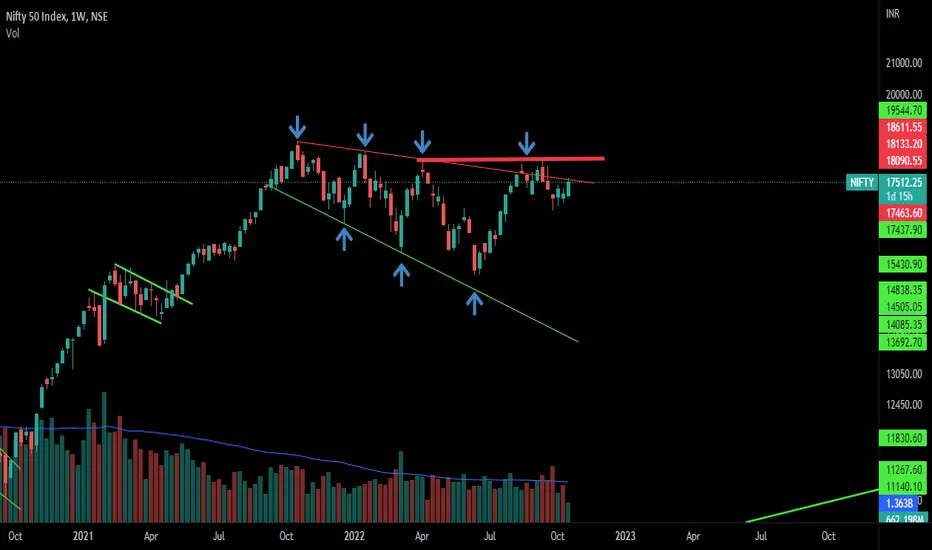
A trendline from the last year's 2021 October highs is where Nifty is facing resistance right now.
Once this is crossed then the immediate resistance will be recent highs which is at 18100.
If it couldn't sustain then Nifty might see 16300 again.
This week's closing candle can give us a clear picture of the upcoming Nifty move.
Watch out for upcoming moves.
Once this is crossed then the immediate resistance will be recent highs which is at 18100.
If it couldn't sustain then Nifty might see 16300 again.
This week's closing candle can give us a clear picture of the upcoming Nifty move.
Watch out for upcoming moves.

GK_Cheerla
免责声明
这些信息和出版物并非旨在提供,也不构成TradingView提供或认可的任何形式的财务、投资、交易或其他类型的建议或推荐。请阅读使用条款了解更多信息。
GK_Cheerla
免责声明
这些信息和出版物并非旨在提供,也不构成TradingView提供或认可的任何形式的财务、投资、交易或其他类型的建议或推荐。请阅读使用条款了解更多信息。