
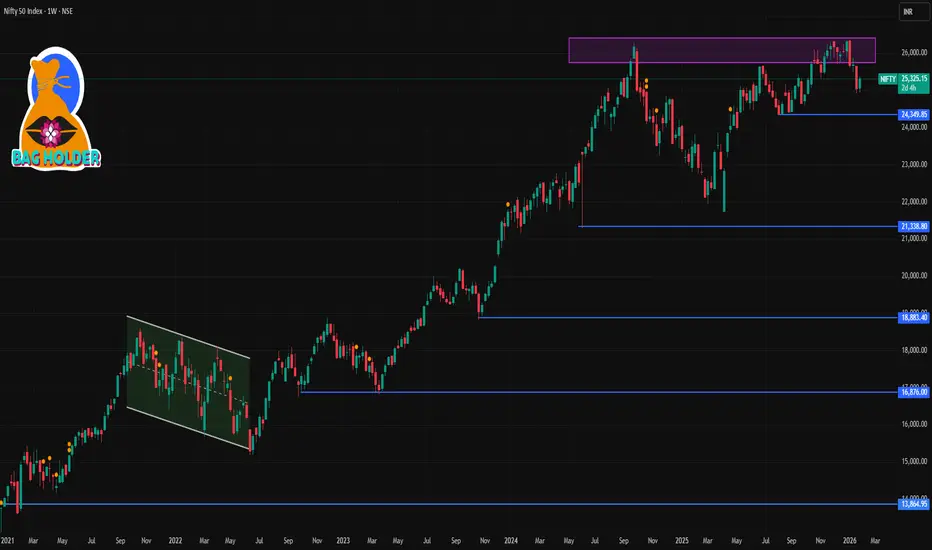
📊 Current Level (approx)
Nifty 50 ~ 25,200–25,350 area as of the last trading sessions (January 27–28, 2026).
📈 Key Weekly Levels to Watch
🔹 Immediate Resistance
1. ~25,300–25,350 — short‑term upside barrier (recent highs around these levels).
2. ~25,500–25,700+ — next major resistance zone (from prior weekly technical analysis, a breakout above ~26,100 historically signalled stronger bullish control).
🔻 Support Zones
1. ~24,900–25,000 — key short‑term support defended in recent sessions and noted by traders as a pivot area.
2. ~24,500–24,700 — broader weekly support zone (buffer from intermediate trend lines / moving averages).
3. ~24,200–24,300 — deeper weekly support; breach here could imply stronger correction risk.
📌 Weekly Trading Range (Probable)
Based on recent technical ranges and previous weekly outlooks:
➡️ Bullish bias above ~25,000 with resistance towards 25,500–25,700+.
➡️ Bearish/mixed bias if breaks below ~24,900, with support down to 24,500 and 24,200 zones.
⚠️ Important Notes
These levels are technical references used by traders — not investment advice.
Weekly support/resistance can shift quickly with strong market moves or macro events (especially around global policy news or earnings).
Always use stop losses and proper risk management if trading off these levels.
Nifty 50 ~ 25,200–25,350 area as of the last trading sessions (January 27–28, 2026).
📈 Key Weekly Levels to Watch
🔹 Immediate Resistance
1. ~25,300–25,350 — short‑term upside barrier (recent highs around these levels).
2. ~25,500–25,700+ — next major resistance zone (from prior weekly technical analysis, a breakout above ~26,100 historically signalled stronger bullish control).
🔻 Support Zones
1. ~24,900–25,000 — key short‑term support defended in recent sessions and noted by traders as a pivot area.
2. ~24,500–24,700 — broader weekly support zone (buffer from intermediate trend lines / moving averages).
3. ~24,200–24,300 — deeper weekly support; breach here could imply stronger correction risk.
📌 Weekly Trading Range (Probable)
Based on recent technical ranges and previous weekly outlooks:
➡️ Bullish bias above ~25,000 with resistance towards 25,500–25,700+.
➡️ Bearish/mixed bias if breaks below ~24,900, with support down to 24,500 and 24,200 zones.
⚠️ Important Notes
These levels are technical references used by traders — not investment advice.
Weekly support/resistance can shift quickly with strong market moves or macro events (especially around global policy news or earnings).
Always use stop losses and proper risk management if trading off these levels.

Contact Knowledgehub for a detailed consultation: Dm on WhatsApp: [wa.link/a2o0kz]-
Phone No: [+91 93102 26243]-
Email: [tradingviewknowledgehub@gmail.com]---
-- Let’s achieve success together!
Phone No: [+91 93102 26243]-
Email: [tradingviewknowledgehub@gmail.com]---
-- Let’s achieve success together!
相关出版物
免责声明
这些信息和出版物并非旨在提供,也不构成TradingView提供或认可的任何形式的财务、投资、交易或其他类型的建议或推荐。请阅读使用条款了解更多信息。
Contact Knowledgehub for a detailed consultation: Dm on WhatsApp: [wa.link/a2o0kz]-
Phone No: [+91 93102 26243]-
Email: [tradingviewknowledgehub@gmail.com]---
-- Let’s achieve success together!
Phone No: [+91 93102 26243]-
Email: [tradingviewknowledgehub@gmail.com]---
-- Let’s achieve success together!
相关出版物
免责声明
这些信息和出版物并非旨在提供,也不构成TradingView提供或认可的任何形式的财务、投资、交易或其他类型的建议或推荐。请阅读使用条款了解更多信息。