
1. Macro Cycle Context & Wave A (Irregular Flat Setup)
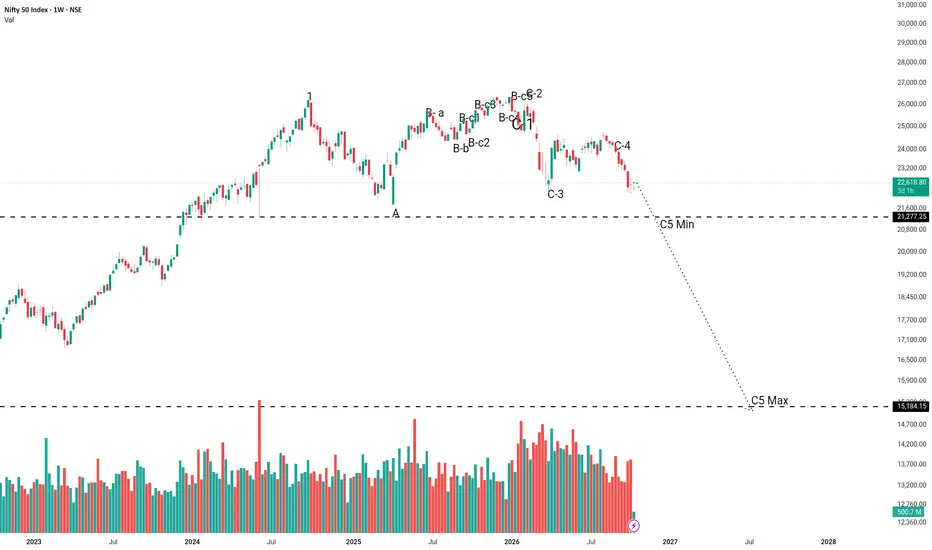
The grand bull cycle that commenced in 2020 culminated in a major peak in September 2024, marking the completion of the primary first wave. Following this high, Nifty initiated a complex corrective phase characterized by an irregular (expanded) flat (A-B-C) correction.
During this setup:
* Wave A unfolded in a distinct three-wave corrective structure.
* Wave B subsequently surged above the origin of Wave A. This behavior is standard textbook action for an irregular flat, where the corrective up-move traps breakout traders by exceeding the previous high. Crucially, the velocity, internal overlap, and structural anatomy of this up-move lacked impulsive characteristics, confirming its corrective nature as a typical bullish-faint Wave B.
2. The Birth of Wave C and the Current Impulsive Count (C_1 to C_5)
Following the termination of Wave B, the sharp downward Wave C leg kicked off in January 2026. Unlike the overlapping corrective swings seen prior, this downward sequence exhibits clear impulsive properties, subdividing into five distinct internal subwaves labeled from C_1 through C_5.
We are currently tracking the final progress of C_5, which is approaching major structural support levels.
3. Key Targets & Risk Parameters (C_{min} vs. C_{max})
To manage risk and establish clear technical reference points for the conclusion of this decline, we monitor two major thresholds:
* C_{min} (Minimum Target / Primary Support): The initial conservative target zone where subwave C_5 is expected to exhaust itself against primary historical demand and structural channel support.
* C_{max} (Macro Extension Target): A lower extreme support tier. This level is reserved strictly as a worst-case contingency scenario should macroeconomic headwinds intensify aggressively.
The grand bull cycle that commenced in 2020 culminated in a major peak in September 2024, marking the completion of the primary first wave. Following this high, Nifty initiated a complex corrective phase characterized by an irregular (expanded) flat (A-B-C) correction.
During this setup:
* Wave A unfolded in a distinct three-wave corrective structure.
* Wave B subsequently surged above the origin of Wave A. This behavior is standard textbook action for an irregular flat, where the corrective up-move traps breakout traders by exceeding the previous high. Crucially, the velocity, internal overlap, and structural anatomy of this up-move lacked impulsive characteristics, confirming its corrective nature as a typical bullish-faint Wave B.
2. The Birth of Wave C and the Current Impulsive Count (C_1 to C_5)
Following the termination of Wave B, the sharp downward Wave C leg kicked off in January 2026. Unlike the overlapping corrective swings seen prior, this downward sequence exhibits clear impulsive properties, subdividing into five distinct internal subwaves labeled from C_1 through C_5.
We are currently tracking the final progress of C_5, which is approaching major structural support levels.
3. Key Targets & Risk Parameters (C_{min} vs. C_{max})
To manage risk and establish clear technical reference points for the conclusion of this decline, we monitor two major thresholds:
* C_{min} (Minimum Target / Primary Support): The initial conservative target zone where subwave C_5 is expected to exhaust itself against primary historical demand and structural channel support.
* C_{max} (Macro Extension Target): A lower extreme support tier. This level is reserved strictly as a worst-case contingency scenario should macroeconomic headwinds intensify aggressively.

免责声明
这些信息和出版物并非旨在提供,也不构成TradingView提供或认可的任何形式的财务、投资、交易或其他类型的建议或推荐。请阅读使用条款了解更多信息。
免责声明
这些信息和出版物并非旨在提供,也不构成TradingView提供或认可的任何形式的财务、投资、交易或其他类型的建议或推荐。请阅读使用条款了解更多信息。