
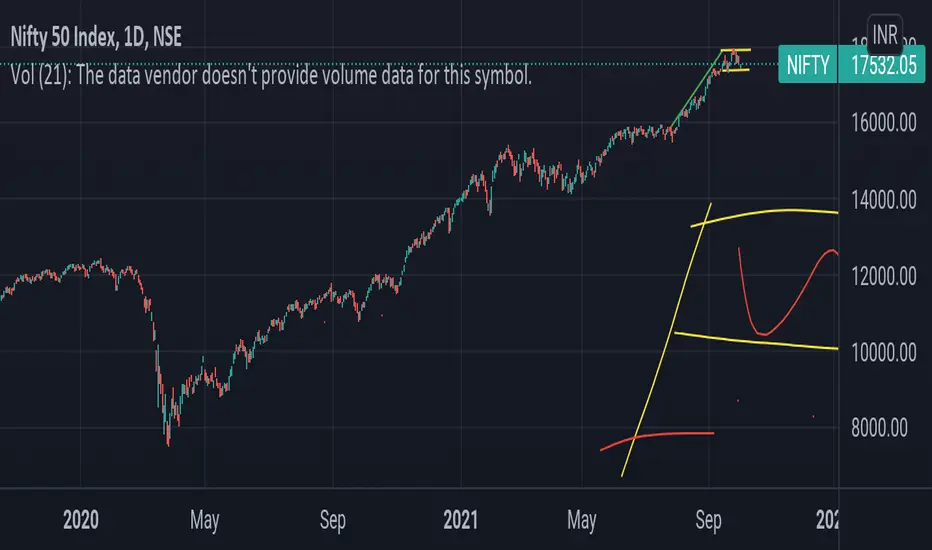
🛑 Nifty forming Flag pattern in daily frame
➡️ From aug to sep It rallied about 12%-13%
From 15900-17900
◽ This rally confirm that Other time frame players were present (OTF) Means big players were involved in this rally to take the market towards all time high
➡️ Now , it's corrected about 2%-3% from all time high
◽Means its saying that short term Bulls were exiting from Thier position or in other words weak players were exiting
◽Look like market is consolidating maybe this can continue for some days , as market is showing weakness so Bears can active and there is a chance they can short the market
◽Stay light on your position and reduce your quantity until market close above 17950-18000 levels
I hope that it will help a lot ,
If you like it do follow
Have a nice day 😊
➡️ From aug to sep It rallied about 12%-13%
From 15900-17900
◽ This rally confirm that Other time frame players were present (OTF) Means big players were involved in this rally to take the market towards all time high
➡️ Now , it's corrected about 2%-3% from all time high
◽Means its saying that short term Bulls were exiting from Thier position or in other words weak players were exiting
◽Look like market is consolidating maybe this can continue for some days , as market is showing weakness so Bears can active and there is a chance they can short the market
◽Stay light on your position and reduce your quantity until market close above 17950-18000 levels
I hope that it will help a lot ,
If you like it do follow
Have a nice day 😊

免责声明
这些信息和出版物并非旨在提供,也不构成TradingView提供或认可的任何形式的财务、投资、交易或其他类型的建议或推荐。请阅读使用条款了解更多信息。
免责声明
这些信息和出版物并非旨在提供,也不构成TradingView提供或认可的任何形式的财务、投资、交易或其他类型的建议或推荐。请阅读使用条款了解更多信息。