
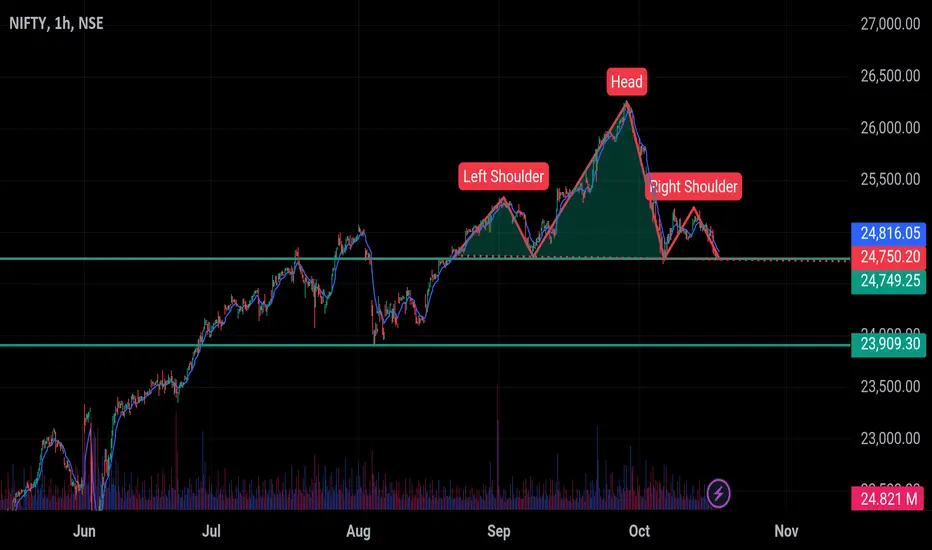
NIFTY makes Head and shoulder pattern in 1H Time frame ..........if it's breaking the levels then We will see in negetive movement in market...
Nifty 50 has broken through the floor of a rising trend channel in the short term. This indicates a slower rising rate at first, or the start of a more horizontal development. The index has broken a head and shoulders formation. A decisive break, preferably with increasing volume, is considered a confident signal of the start of a falling trend. The index has broken down through support at points 25000. This predicts a further decline. RSI below 30 shows that the momentum of the index is strongly negative in the short term. Investor have steadily reduced the price to sell the index, which indicates increasing pessimism and continued falling prices. However, particularly in big stocks, low RSI may be a sign that the stock is oversold and that there is a chance for a reaction upwards. The index is overall assessed as technically negative for the short term.
Nifty 50 has broken through the floor of a rising trend channel in the short term. This indicates a slower rising rate at first, or the start of a more horizontal development. The index has broken a head and shoulders formation. A decisive break, preferably with increasing volume, is considered a confident signal of the start of a falling trend. The index has broken down through support at points 25000. This predicts a further decline. RSI below 30 shows that the momentum of the index is strongly negative in the short term. Investor have steadily reduced the price to sell the index, which indicates increasing pessimism and continued falling prices. However, particularly in big stocks, low RSI may be a sign that the stock is oversold and that there is a chance for a reaction upwards. The index is overall assessed as technically negative for the short term.

相关出版物
免责声明
这些信息和出版物并非旨在提供,也不构成TradingView提供或认可的任何形式的财务、投资、交易或其他类型的建议或推荐。请阅读使用条款了解更多信息。