
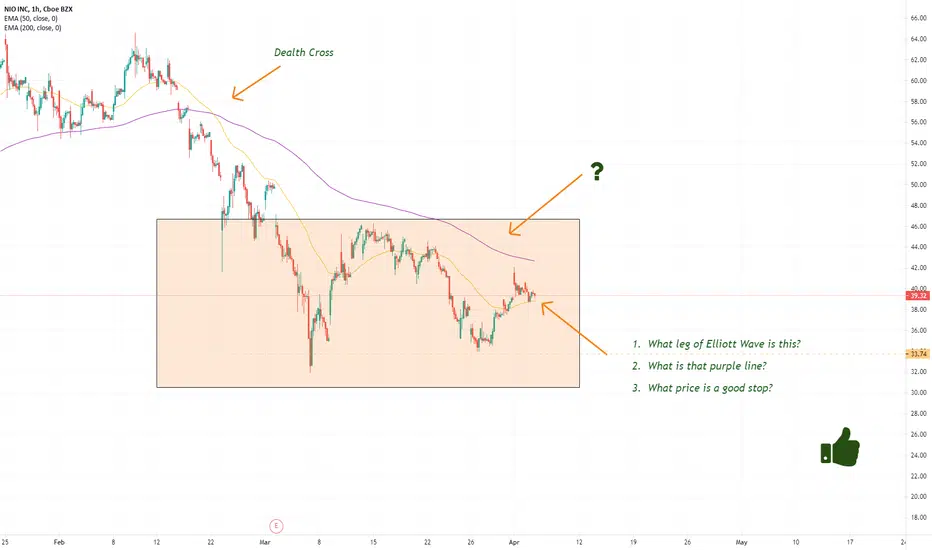
1. What leg of Elliott Wave is this? Double Bottom in Leg B
2. What is that purple line? Major Resistance
3. What price is a good stop? $33.74
Thank you for reading!
Greenfield
Starting April 19, for early access to my weekly chart price interpretation for cryptocurrency, gold, and a random stock, please subscribe to my YouTube.
youtube.com/channel/UC1uQWStOxAlA27PAuOdfZxw/videos
Disclosure: I am not a financial advisor. This is not a recommendation, not a representation, and not a solicitation. You should do your research and come to your own decision. Investment involves significant risks. You need to understand that you may lose your money. Past performance is not an indication of future performance. Chart reading is subjective information.

免责声明
这些信息和出版物并非旨在提供,也不构成TradingView提供或认可的任何形式的财务、投资、交易或其他类型的建议或推荐。请阅读使用条款了解更多信息。