
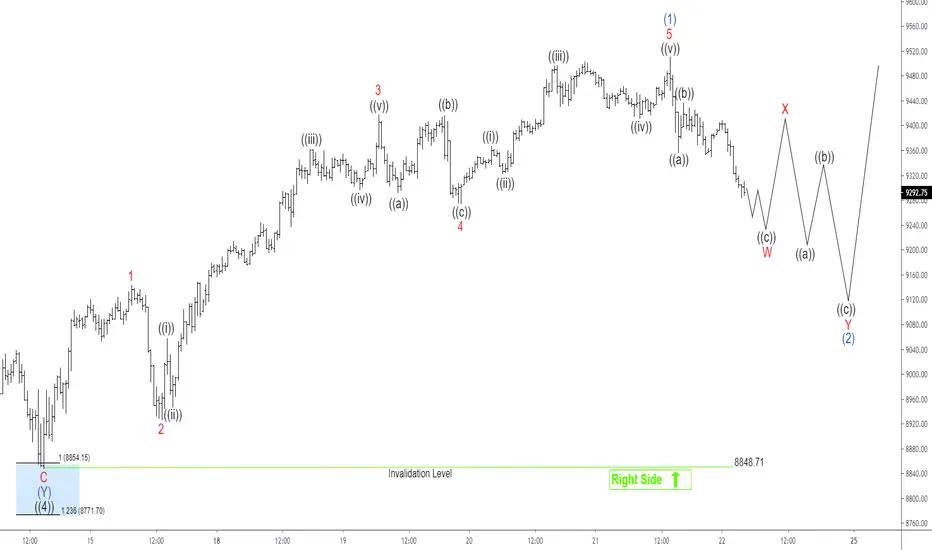
Short term Elliott Wave chart below suggests the dips to 8848.71 ended wave ((4)). This is part of a larger impulsive rally which started from 3.23.2020 low. Wave ((5)) is currently in progress as 5 waves in lesser degree. Up from wave ((4)) at 8848.71, wave 1 ended at 9143, and pullback in wave 2 ended at 8925.50. Index then resumed higher in wave 3 towards 9417.25 and wave 4 pullback ended at 9273.
Final leg higher in wave 5 ended at 9510.75 and this also completed wave (1) of ((5)). Wave (2) pullback is currently in progress to correct cycle from 5.14.2020 low before the rally resumes. Internal subdivision of wave (2) is unfolding as a double three where wave W should end soon as a zigzag. Index should then bounce in wave X and then turn lower again in 3 waves to complete wave Y of (2).
Index should then resume higher again in wave (3) of ((5)) provided that pivot at 8848.71 low stays intact. Dips in the Index should find support in 3, 7, or 11 swing against 8848.71 in the first degree. If pivot at 8848.71 low fails, then Index may have ended cycle from 3.23.2020 low. In this case, a larger pullback should happen before Nasdaq resumes again.
Final leg higher in wave 5 ended at 9510.75 and this also completed wave (1) of ((5)). Wave (2) pullback is currently in progress to correct cycle from 5.14.2020 low before the rally resumes. Internal subdivision of wave (2) is unfolding as a double three where wave W should end soon as a zigzag. Index should then bounce in wave X and then turn lower again in 3 waves to complete wave Y of (2).
Index should then resume higher again in wave (3) of ((5)) provided that pivot at 8848.71 low stays intact. Dips in the Index should find support in 3, 7, or 11 swing against 8848.71 in the first degree. If pivot at 8848.71 low fails, then Index may have ended cycle from 3.23.2020 low. In this case, a larger pullback should happen before Nasdaq resumes again.

14 days trial --> elliottwave-forecast.com/plan-trial/ and get Accurate & timely Elliott Wave Forecasts of 78 instruments. Webinars, Chat Room, Stocks/Forex/Indices Signals & more.
免责声明
这些信息和出版物并非旨在提供,也不构成TradingView提供或认可的任何形式的财务、投资、交易或其他类型的建议或推荐。请阅读使用条款了解更多信息。
14 days trial --> elliottwave-forecast.com/plan-trial/ and get Accurate & timely Elliott Wave Forecasts of 78 instruments. Webinars, Chat Room, Stocks/Forex/Indices Signals & more.
免责声明
这些信息和出版物并非旨在提供,也不构成TradingView提供或认可的任何形式的财务、投资、交易或其他类型的建议或推荐。请阅读使用条款了解更多信息。