
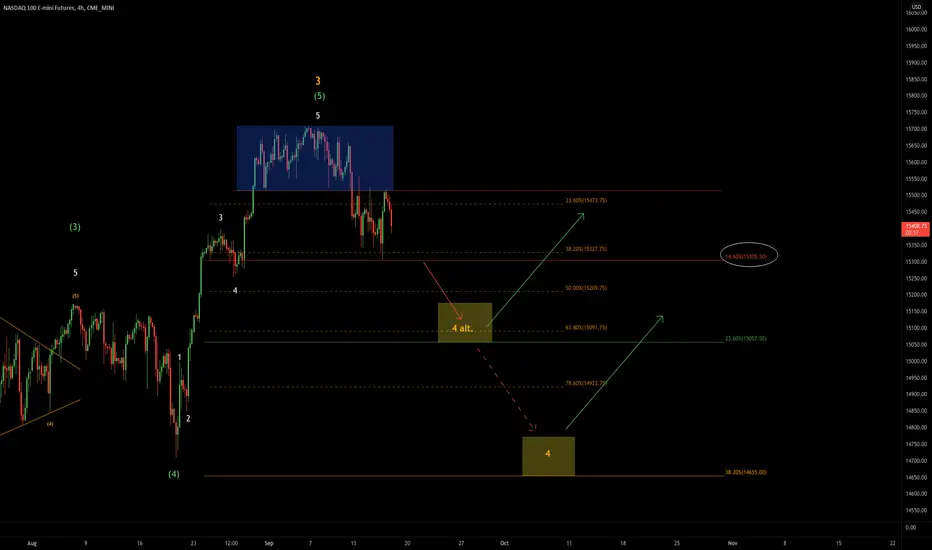
A few more words about the Nasdaq: Since August 19th - September 6th you can see a very nice 5 wavy impulse. From the low to the high, there is still potential for correction if you just look at this single wave movement. Gladly the Fibo range between 50 and 61.8%. In other words: 15,000 can easily be reached. That would then also correlate with my superordinate wave count. If the market does not hold at 15,000, we quickly head for 14.6xx. But there is always the condition theory: If that, then that;) If the 15.306 is not undercut on a daily basis, nothing happens at first. If this level breaks, however, this leads to (probably) more pressure to sell. So everything is causally related. That's why you have to look at each step individually.

免责声明
这些信息和出版物并非旨在提供,也不构成TradingView提供或认可的任何形式的财务、投资、交易或其他类型的建议或推荐。请阅读使用条款了解更多信息。