
Hello everyone, 👋
We're back to NASDAQ.
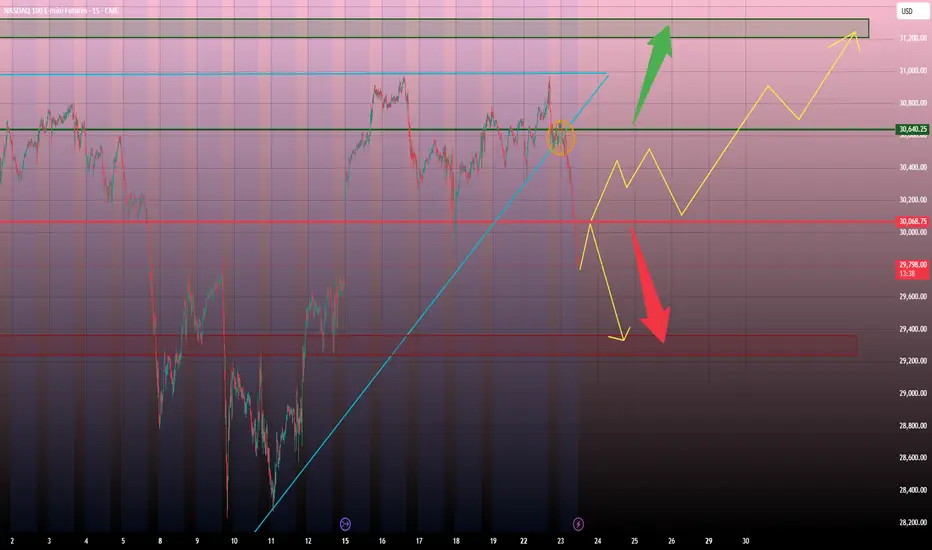
Similar to BTC analysis, on NQ we managed to capture a small but profitable move. Today, after the U.S. market close, the situation shifted and brought us a decline of approximately 800 points.
On the chart, we can see a forming triangle pattern, with the price currently breaking to the downside. However, to confirm the bearish scenario, we would ideally like to see a retest of the red trendline, followed by another move lower — a setup I plan to trade.
There is also a possibility that the price returns to the range between 30 640 and 30 060. In that case, it would be wise to wait for further confirmation and a clear breakout signal from the levels marked on the chart before taking any positions.
🟢 As always, a break above the green level will have me looking for immediate long opportunities.
🔴 A break below the red level will shift my focus toward potential short setups.
GOOD LUCK TRADERS !!
⚠️ This analysis is for educational and informational purposes only and should not be considered financial advice. Always conduct your own research and manage risk appropriately before making any trading decisions.
交易手动结束
Hello, I managed to catch part of the move, even though the target was not reached.
The position was closed with a small profit.
💚 +73 points on NQ! 💚

免责声明
这些信息和出版物并非旨在提供,也不构成TradingView提供或认可的任何形式的财务、投资、交易或其他类型的建议或推荐。请阅读使用条款了解更多信息。
免责声明
这些信息和出版物并非旨在提供,也不构成TradingView提供或认可的任何形式的财务、投资、交易或其他类型的建议或推荐。请阅读使用条款了解更多信息。