
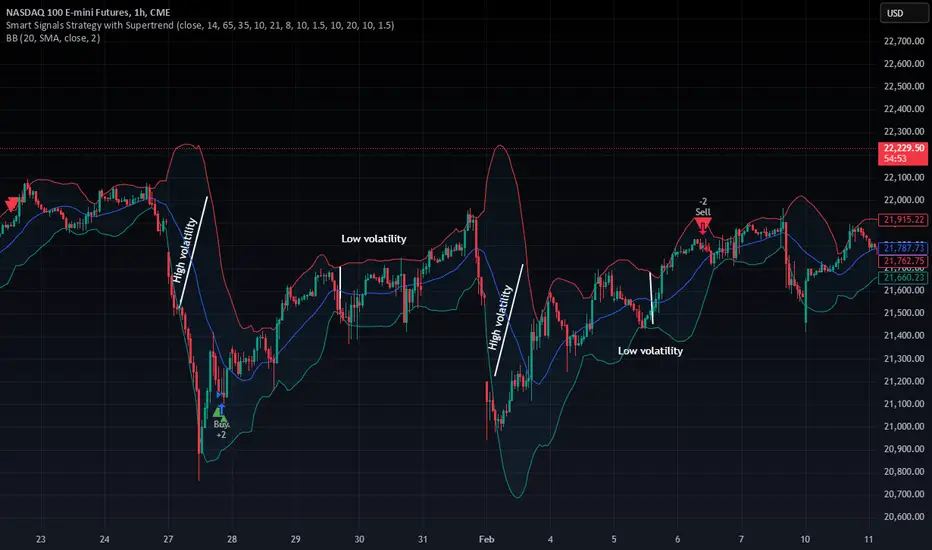
Bollinger Bands are a technical indicator used to measure market volatility and identify overbought or oversold conditions. They consist of three bands:
- Middle Band – A 20-period Simple Moving Average (SMA).
- Upper Band – SMA + 2 standard deviations (indicates overbought).
- Lower Band – SMA - 2 standard deviations (indicates oversold).
Key Strategies:
- Overbought/Oversold: Price near the upper band may indicate a reversal down, while price near the lower band suggests a potential bounce.
- Bollinger Squeeze: When bands tighten, low volatility signals a possible breakout.
- Trend Confirmation: In strong uptrends, price tends to "walk the band" near the upper side.
Trade Example:
- Buy when price bounces off the lower band with confirmation
- Sell when price touches the upper band with bearish signals.
- Stop loss: Just below the lower band in a long trade.
Always combine Bollinger Bands with volume, RSI, or MACD for better accuracy!
- Middle Band – A 20-period Simple Moving Average (SMA).
- Upper Band – SMA + 2 standard deviations (indicates overbought).
- Lower Band – SMA - 2 standard deviations (indicates oversold).
Key Strategies:
- Overbought/Oversold: Price near the upper band may indicate a reversal down, while price near the lower band suggests a potential bounce.
- Bollinger Squeeze: When bands tighten, low volatility signals a possible breakout.
- Trend Confirmation: In strong uptrends, price tends to "walk the band" near the upper side.
Trade Example:
- Buy when price bounces off the lower band with confirmation
- Sell when price touches the upper band with bearish signals.
- Stop loss: Just below the lower band in a long trade.
Always combine Bollinger Bands with volume, RSI, or MACD for better accuracy!

免责声明
这些信息和出版物并非旨在提供,也不构成TradingView提供或认可的任何形式的财务、投资、交易或其他类型的建议或推荐。请阅读使用条款了解更多信息。
免责声明
这些信息和出版物并非旨在提供,也不构成TradingView提供或认可的任何形式的财务、投资、交易或其他类型的建议或推荐。请阅读使用条款了解更多信息。