
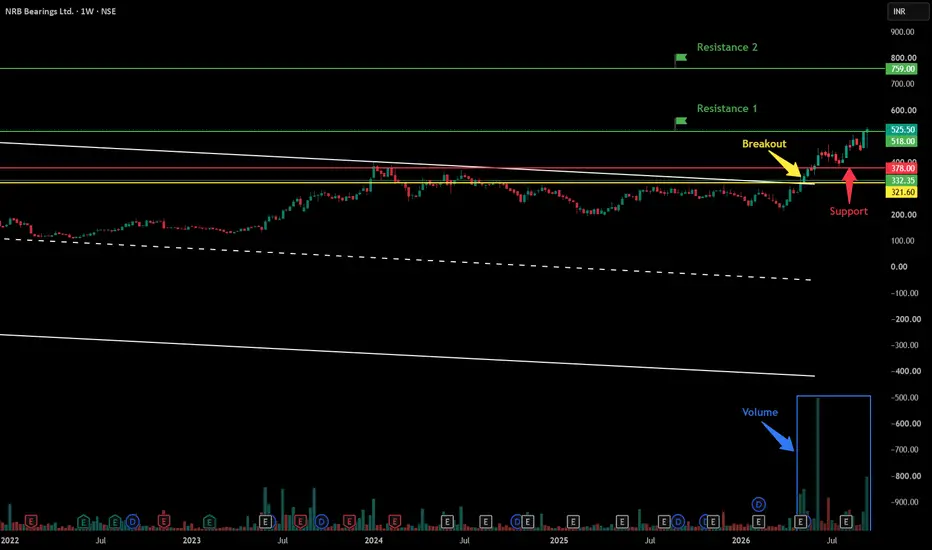
#NRBBEARING trading above Resistance of 518
Next Resistance is at 759
Support is at 378
Here is previous chart:
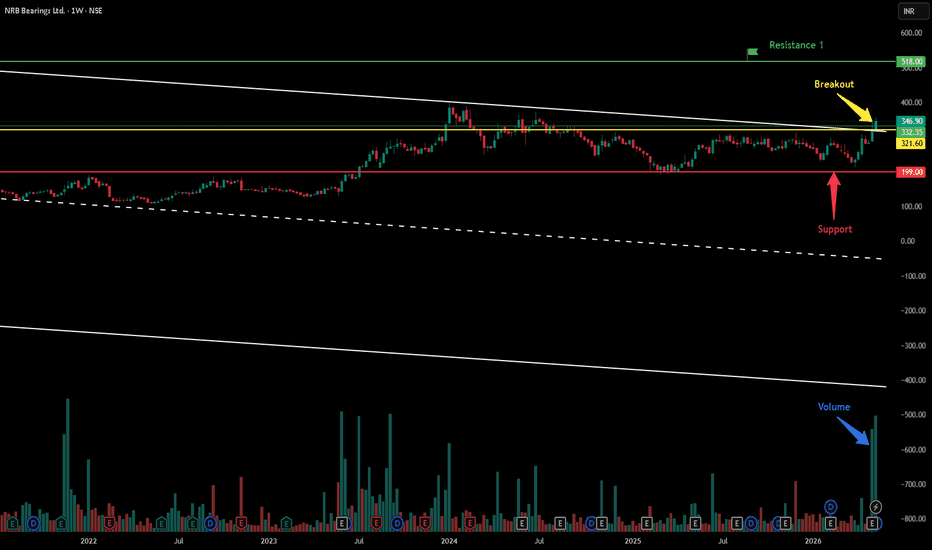
This weekly chart for NRB Bearings Limited displays a strong bullish breakout from a consolidation pattern, supported by significant volume and long-term trendline context.
Chart Overview
Timeframe & Asset: NRB Bearings Ltd. (1-Week Chart, NSE).
Current Price: 525.50 INR (+2.11% change shown on the chart header).
Key Technical Observations
Horizontal & Channel Breakout: The stock consolidated within a downward-sloping mini-channel (white lines) and horizontal consolidation zone before breaking out above 321.60 INR, marked by the yellow Breakout arrow.
Volume Expansion: The blue arrow highlights a substantial surge in trading volume during the initial breakout phase, confirming strong institutional buying conviction.
Support Levels:
321.60 INR (Yellow Line): The horizontal level corresponding to the initial breakout point and dynamic base support.
378.00 INR (Red Line): A major horizontal level (marked with a red arrow) that previously acted as resistance before flipping to become the primary structural support level on subsequent pullbacks.
Resistance Levels:
Resistance 1 (518.00 INR): A structural resistance level (green line) that the current price candle has tested and breached to trade at 525.50 INR.
Resistance 2 (759.00 INR): The long-term upside projection level marked near the top green line.
Long-Term Trend Lines: The solid blue lines form a multi-year ascending channel that defines the macro uptrend, with the price currently advancing along the upper expansion zone above this channel.
Conclusion & Current Price Action
The current price action reflects strong bullish momentum following the volume-backed breakout above 321.60 INR and a successful retest of the 378.00 INR support zone. The stock has recently cleared its immediate hurdle at Resistance 1 (518.00 INR).
A sustained weekly close above this Resistance 1 zone indicates room for extended upside toward the long-term upside projection level of 759.00 INR (Resistance 2). On any potential pullbacks, the 378.00 INR level will serve as the primary line of defense for buyers to keep the structural uptrend intact.
A parallel channel (also known as an ascending, descending, or horizontal channel) is a technical analysis pattern bounded by two parallel trendlines that encompass a security’s price action over time.
Structure & Mechanics
Main Components:
Trendline / Base Line: Connects a series of prominent reaction lows (in an uptrend) or reaction highs (in a downtrend).
Channel Line: Drawn parallel to the trendline, connecting the peaks (top boundary) or troughs (bottom boundary).
Price Movement: Price oscillates between the upper boundary (which acts as dynamic resistance) and the lower boundary (which acts as dynamic support).
Types of Channels
Ascending Channel (Bullish): Characterized by higher highs and higher lows. Indicates a steady uptrend where buying pressure dominates.
Descending Channel (Bearish): Characterized by lower highs and lower lows. Represents a controlled downtrend or corrective pullback.
Horizontal Channel (Consolidation): Moving sideways between static support and resistance lines, signaling market indecision or range-bound trading.
How Traders Use Parallel Channels
Trading Within the Range: Buying near the channel's lower boundary (support) and selling or shorting near the upper boundary (resistance).
Breakout Trading: A strong, high-volume candle breaking outside either boundary signals potential trend acceleration or continuation in the direction of the breakout (as seen in the charts provided previously).
Midline (50% Line): Often, a dashed line is drawn down the middle of the channel. Price reacting to this midline can confirm the channel's validity and act as interim support or resistance.
Disclaimer: This is for demonstration and educational purpose only. This is not buying or selling recommendations. I am not SEBI registered financial advisor. Please consult your financial advisor before taking any trade.
Next Resistance is at 759
Support is at 378
Here is previous chart:
This weekly chart for NRB Bearings Limited displays a strong bullish breakout from a consolidation pattern, supported by significant volume and long-term trendline context.
Chart Overview
Timeframe & Asset: NRB Bearings Ltd. (1-Week Chart, NSE).
Current Price: 525.50 INR (+2.11% change shown on the chart header).
Key Technical Observations
Horizontal & Channel Breakout: The stock consolidated within a downward-sloping mini-channel (white lines) and horizontal consolidation zone before breaking out above 321.60 INR, marked by the yellow Breakout arrow.
Volume Expansion: The blue arrow highlights a substantial surge in trading volume during the initial breakout phase, confirming strong institutional buying conviction.
Support Levels:
321.60 INR (Yellow Line): The horizontal level corresponding to the initial breakout point and dynamic base support.
378.00 INR (Red Line): A major horizontal level (marked with a red arrow) that previously acted as resistance before flipping to become the primary structural support level on subsequent pullbacks.
Resistance Levels:
Resistance 1 (518.00 INR): A structural resistance level (green line) that the current price candle has tested and breached to trade at 525.50 INR.
Resistance 2 (759.00 INR): The long-term upside projection level marked near the top green line.
Long-Term Trend Lines: The solid blue lines form a multi-year ascending channel that defines the macro uptrend, with the price currently advancing along the upper expansion zone above this channel.
Conclusion & Current Price Action
The current price action reflects strong bullish momentum following the volume-backed breakout above 321.60 INR and a successful retest of the 378.00 INR support zone. The stock has recently cleared its immediate hurdle at Resistance 1 (518.00 INR).
A sustained weekly close above this Resistance 1 zone indicates room for extended upside toward the long-term upside projection level of 759.00 INR (Resistance 2). On any potential pullbacks, the 378.00 INR level will serve as the primary line of defense for buyers to keep the structural uptrend intact.
A parallel channel (also known as an ascending, descending, or horizontal channel) is a technical analysis pattern bounded by two parallel trendlines that encompass a security’s price action over time.
Structure & Mechanics
Main Components:
Trendline / Base Line: Connects a series of prominent reaction lows (in an uptrend) or reaction highs (in a downtrend).
Channel Line: Drawn parallel to the trendline, connecting the peaks (top boundary) or troughs (bottom boundary).
Price Movement: Price oscillates between the upper boundary (which acts as dynamic resistance) and the lower boundary (which acts as dynamic support).
Types of Channels
Ascending Channel (Bullish): Characterized by higher highs and higher lows. Indicates a steady uptrend where buying pressure dominates.
Descending Channel (Bearish): Characterized by lower highs and lower lows. Represents a controlled downtrend or corrective pullback.
Horizontal Channel (Consolidation): Moving sideways between static support and resistance lines, signaling market indecision or range-bound trading.
How Traders Use Parallel Channels
Trading Within the Range: Buying near the channel's lower boundary (support) and selling or shorting near the upper boundary (resistance).
Breakout Trading: A strong, high-volume candle breaking outside either boundary signals potential trend acceleration or continuation in the direction of the breakout (as seen in the charts provided previously).
Midline (50% Line): Often, a dashed line is drawn down the middle of the channel. Price reacting to this midline can confirm the channel's validity and act as interim support or resistance.
Disclaimer: This is for demonstration and educational purpose only. This is not buying or selling recommendations. I am not SEBI registered financial advisor. Please consult your financial advisor before taking any trade.

To Learn Price Action Trading & to get our exclusive breakout charts, subscribe here:
linktr.ee/9amprime
Join Telegram (Free) : t.me/join_9amPrime
Contact us : 9amprime@gmail.com
linktr.ee/9amprime
Join Telegram (Free) : t.me/join_9amPrime
Contact us : 9amprime@gmail.com
免责声明
这些信息和出版物并非旨在提供,也不构成TradingView提供或认可的任何形式的财务、投资、交易或其他类型的建议或推荐。请阅读使用条款了解更多信息。
To Learn Price Action Trading & to get our exclusive breakout charts, subscribe here:
linktr.ee/9amprime
Join Telegram (Free) : t.me/join_9amPrime
Contact us : 9amprime@gmail.com
linktr.ee/9amprime
Join Telegram (Free) : t.me/join_9amPrime
Contact us : 9amprime@gmail.com
免责声明
这些信息和出版物并非旨在提供,也不构成TradingView提供或认可的任何形式的财务、投资、交易或其他类型的建议或推荐。请阅读使用条款了解更多信息。