
1. The Macro Perspective: The Massive Accumulation Base
I am taking a LONG bias on NMDC Steel Limited (NSLNISP) on the macro weekly (1W) timeframe.
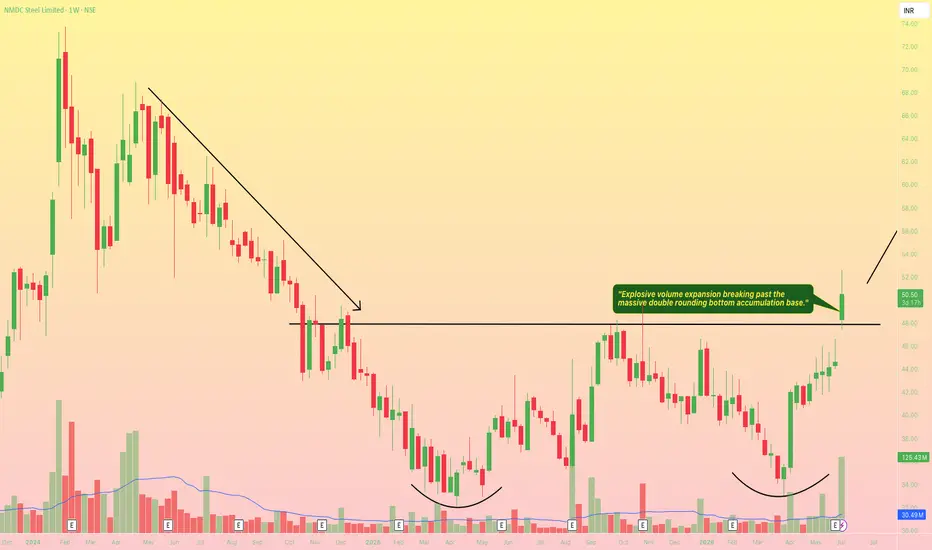
When analyzing pure market structure on an emerging steel manufacturer, massive accumulation bases are critical for initiating long-term secular trends. Following a significant markdown phase from its mid-2024 peak, the stock entered a massive structural bottoming process spanning well over a year. This sideways and rounding consolidation effectively absorbed profit-taking and allowed institutional capital to quietly accumulate shares. The structure took the form of a massive double bottom or "W" base. Fundamentally, this technical momentum aligns perfectly with the company's recent operational turnaround and Q4 FY26 earnings report. The company reported a significant narrowing of its net loss to ₹243.97 crore for the quarter, compared to a steep loss of ₹757.78 crore in the same quarter last year. This fundamental improvement signals successful operational stabilization as its flagship plant ramps up production.
2. The Educational Setup: Horizontal Boundary Defense
To understand the technical validity behind this macro launch, look closely at how the price structure interacted with its core boundaries prior to breaking out:
The 48.00 Resistance Ceiling: The definitive line in the sand for a bullish structural shift was the solid black horizontal resistance line drawn at 48.00. This level established a massive supply zone over previous quarters that systematically capped upward momentum.
The Structural Floors: During the multi-month consolidation, institutional buyers heavily defended the lower boundaries, twice carving out a textbook rounding bottom to form the larger double bottom pattern. This sequence squeezed volatility directly beneath the breakout zone, building immense kinetic energy.
3. Current Price Action: Breakout and Volatility Expansion
Look at the most recent weekly candle on the far right of the chart. The structural pressure cooker has officially exploded. Driven by the improving fundamentals, institutional buyers have stepped in with undeniable conviction. The stock printed a massive, full-bodied green expansion candle that has decisively obliterated the 48.00 multi-month ceiling, currently trading incredibly strong near 50.50. The stock has officially transitioned out of low-volatility accumulation and into a highly explosive markup trend into fresh territory.
4. The Trade Plan: Entries, Targets, and Risk Management
Entry Strategy: Macro momentum is exceptionally strong with the stock trading vertically out in the open. Chasing an extended weekly breakout candle carries a minor risk of a short-term, lower-timeframe mean-reversion pullback. The highest-probability, lowest-risk entry strategy involves stepping down to the daily timeframe and waiting for the initial vertical excitement to cool off. Look to scale into long positions on a potential structural pullback to perfectly retest the broken 46.00 to 48.00 prior resistance zone. Letting old historical resistance prove itself as a concrete new support floor provides an unmatched risk-to-reward ratio.
Take Profit (Targets): By utilizing a classical measured move strategy based on the depth of the accumulation phase, we can project upside targets. Taking the depth of the macro range (roughly 16 points from the structural floor near 32.00 up to the 48.00 ceiling) and projecting it upward from the breakout point, our primary structural macro target sits comfortably in the 64.00 to 68.00 zone over the coming quarters. This aligns perfectly with the major structural peak established prior to the markdown phase.
Invalidation (Stop Loss): An explosive macro breakout thesis is completely invalidated if the price fails to hold its newly claimed structural floor and collapses back inside the core of the base boundaries. A hard stop loss should be placed safely below the recent lower-timeframe swing lows and the mid-level of the breakout, specifically around the 40.00 to 42.00 level. A definitive weekly close completely back below 40.00 would act as a severe warning sign of a failed macro breakout and a major bull trap.
5. Time Horizon:
Because this technical setup captures a clear structural phase transition and a major horizontal breakout on the 1-Week chart, this is a longer-term position trade designed to capture a rapid momentum markup phase over the coming months. Let the macro trend run!
I am taking a LONG bias on NMDC Steel Limited (NSLNISP) on the macro weekly (1W) timeframe.
When analyzing pure market structure on an emerging steel manufacturer, massive accumulation bases are critical for initiating long-term secular trends. Following a significant markdown phase from its mid-2024 peak, the stock entered a massive structural bottoming process spanning well over a year. This sideways and rounding consolidation effectively absorbed profit-taking and allowed institutional capital to quietly accumulate shares. The structure took the form of a massive double bottom or "W" base. Fundamentally, this technical momentum aligns perfectly with the company's recent operational turnaround and Q4 FY26 earnings report. The company reported a significant narrowing of its net loss to ₹243.97 crore for the quarter, compared to a steep loss of ₹757.78 crore in the same quarter last year. This fundamental improvement signals successful operational stabilization as its flagship plant ramps up production.
2. The Educational Setup: Horizontal Boundary Defense
To understand the technical validity behind this macro launch, look closely at how the price structure interacted with its core boundaries prior to breaking out:
The 48.00 Resistance Ceiling: The definitive line in the sand for a bullish structural shift was the solid black horizontal resistance line drawn at 48.00. This level established a massive supply zone over previous quarters that systematically capped upward momentum.
The Structural Floors: During the multi-month consolidation, institutional buyers heavily defended the lower boundaries, twice carving out a textbook rounding bottom to form the larger double bottom pattern. This sequence squeezed volatility directly beneath the breakout zone, building immense kinetic energy.
3. Current Price Action: Breakout and Volatility Expansion
Look at the most recent weekly candle on the far right of the chart. The structural pressure cooker has officially exploded. Driven by the improving fundamentals, institutional buyers have stepped in with undeniable conviction. The stock printed a massive, full-bodied green expansion candle that has decisively obliterated the 48.00 multi-month ceiling, currently trading incredibly strong near 50.50. The stock has officially transitioned out of low-volatility accumulation and into a highly explosive markup trend into fresh territory.
4. The Trade Plan: Entries, Targets, and Risk Management
Entry Strategy: Macro momentum is exceptionally strong with the stock trading vertically out in the open. Chasing an extended weekly breakout candle carries a minor risk of a short-term, lower-timeframe mean-reversion pullback. The highest-probability, lowest-risk entry strategy involves stepping down to the daily timeframe and waiting for the initial vertical excitement to cool off. Look to scale into long positions on a potential structural pullback to perfectly retest the broken 46.00 to 48.00 prior resistance zone. Letting old historical resistance prove itself as a concrete new support floor provides an unmatched risk-to-reward ratio.
Take Profit (Targets): By utilizing a classical measured move strategy based on the depth of the accumulation phase, we can project upside targets. Taking the depth of the macro range (roughly 16 points from the structural floor near 32.00 up to the 48.00 ceiling) and projecting it upward from the breakout point, our primary structural macro target sits comfortably in the 64.00 to 68.00 zone over the coming quarters. This aligns perfectly with the major structural peak established prior to the markdown phase.
Invalidation (Stop Loss): An explosive macro breakout thesis is completely invalidated if the price fails to hold its newly claimed structural floor and collapses back inside the core of the base boundaries. A hard stop loss should be placed safely below the recent lower-timeframe swing lows and the mid-level of the breakout, specifically around the 40.00 to 42.00 level. A definitive weekly close completely back below 40.00 would act as a severe warning sign of a failed macro breakout and a major bull trap.
5. Time Horizon:
Because this technical setup captures a clear structural phase transition and a major horizontal breakout on the 1-Week chart, this is a longer-term position trade designed to capture a rapid momentum markup phase over the coming months. Let the macro trend run!
交易结束:到达止损
Price crashed after fake breakout.
免责声明
这些信息和出版物并非旨在提供,也不构成TradingView提供或认可的任何形式的财务、投资、交易或其他类型的建议或推荐。请阅读使用条款了解更多信息。
免责声明
这些信息和出版物并非旨在提供,也不构成TradingView提供或认可的任何形式的财务、投资、交易或其他类型的建议或推荐。请阅读使用条款了解更多信息。