
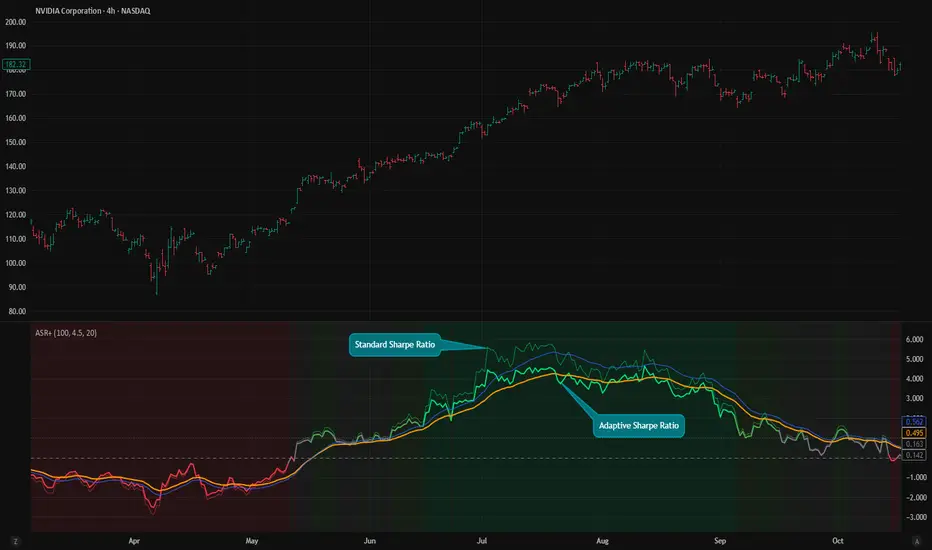
A statistical follow-up to the ASR+ indicator. Full indicator framework and open-source Pine Script are available on the main script page linked at the bottom of this publication.
--------------------------------------------------------------------------
🔍 WHAT ASR+ IS (THE STRUCTURAL ANCHOR)
The classical Standard Sharpe Ratio (SSR) assumes that financial asset returns are independent, identically distributed (IID), and normal random variables. Real-world markets routinely violate all three assumptions through serial autocorrelation, volatility clustering, and fat-tailed return distributions. When these classical assumptions break down, standard Sharpe calculations become artificially inflated and unstable, underestimating true downside exposure precisely when risk measurement matters most.
ASR+ corrects for this by applying four distinct statistical adjustments simultaneously:
• HAC / Newey-West Correction: Uses a 4-lag Bartlett kernel to remove estimation bias caused by serial correlation in trending or mean-reverting regimes.
• Cornish-Fisher Tail Adjustment: Incorporates skewness and excess kurtosis into the risk estimate at the 95% confidence level, penalizing asymmetric or heavy-tailed distributions.
• Volatility Regime Penalty: Scales conservatism dynamically by assessing current volatility relative to its long-term historical average.
• Small-Sample Uncertainty Correction: Applies a bias correction to account for estimation errors on shorter lookback windows.
The result is a distribution-aware estimate of risk-adjusted performance that moderates inflated readings during highly unstable or non-IID market conditions.
--------------------------------------------------------------------------
📊 PART I — CROSS-SECTIONAL VALIDATION: WILCOXON SIGNED-RANK TEST
raw.githubusercontent.com/TrendAdvantage/tradingview-images/main/asr_scatter_with_table.png
To verify that ASR+ produces statistically distinct outputs from the Standard Sharpe Ratio rather than introducing redundant noise, a Wilcoxon signed-rank test was executed across 30 major tickers. The study utilized 63-day rolling metrics with 21-day stepped sampling over a 5-year window (2020–2025). The Wilcoxon test was selected because it makes no assumptions regarding the normality of the underlying distributions.
Key Results:
• Tickers with significant divergence (p < 0.05): 18 / 30
• Highly significant tickers (p < 0.001): 5 / 30
• Global Z-score: -12.51
• Global p-value: < 0.0001
• Median Delta (ASR+ - SSR): -0.0919
What the pattern reveals
The structural divergence is highly asset-specific and reveals that non-Gaussian return profiles affect defensive and growth equities alike. For example, as displayed in the
"ASR+ Reductions" data table, the consumer staple WMT experienced the largest global adjustment (-24.86%), outpacing high-beta growth engines like TSLA (-23.79%) and NVDA (-16.26%).
This highlights a critical reality: standard Sharpe estimates can heavily overstate risk-adjusted performance even in traditionally "defensive" assets if their underlying return streams
suffer from severe serial autocorrelation or structural tail-risk. ASR+ applies its strongest corrections dynamically across the board, precisely where these classical assumptions fail.
The Wilcoxon analysis established that the two measures diverge systematically; the next question was whether that divergence contains information about future signal quality.
--------------------------------------------------------------------------
⏱️ PART II — THE FORWARD PERSISTENCE AUDIT
raw.githubusercontent.com/TrendAdvantage/tradingview-images/main/adaptive_sharpe_audit-Final.png
While a Wilcoxon test confirms statistical divergence, it does not inherently prove forward-looking utility. If two separate assets display identical, highly attractive standard Sharpe Ratios, one may be driven by stable, persistent edge, while the other is an unstable artifact of structural noise or temporary volatility clustering.
To determine whether the magnitude of disagreement between the two metrics contains information about signal decay, a forward-persistence audit was conducted across 40 equities.
We define the absolute structural divergence parameter as:
|Δ| = |ASR+ - SSR|
Filtering exclusively for strong nominal performances (SSR > 1.0), observations were segregated into Low-|Δ| ("Reliable") and High-|Δ| ("Fragile") cohorts using tercile separation. The realized Sharpe Ratio was then tracked over the subsequent 63 trading days.
Audit Findings:
• High-|Δ| ("Fragile") signals experienced approximately 4.2× greater Sharpe decay over the forward 63-day window.
• Low-|Δ| ("Reliable") signals maintained materially stronger forward Sharpe persistence.
• The outperformance and group separation were verified as highly significant under a Mann-Whitney U test.
The divergence parameter (|Δ|) functions effectively as a structural reliability filter. An elevated nominal Sharpe accompanied by a large divergence gap indicates fragile, regime-dependent performance that decays rapidly back to market noise.
--------------------------------------------------------------------------
🛠️ PART III — PRACTICAL APPLICATIONS & LIVE EXECUTION
raw.githubusercontent.com/TrendAdvantage/tradingview-images/main/practical_implications.png
The following framework outlines exploratory applications derived directly from the forward-persistence audit data.
1. Signal & Entry Filtering
Before entering a position based on a strong nominal Sharpe value, examine the physical distance between the standard line and the adaptive line on your chart. A wide divergence gap (|Δ|) alerts you that the performance is regime-dependent or driven by temporary volatility clustering. Consider passing on setups where the structural divergence is abnormally elevated.
2. Risk Budgeting & Position Sizing
Incorporate the divergence parameter as a confidence scalar for capital allocation. Because high-divergence signals carry 4.2× more forward decay risk for the exact same nominal Sharpe reading, they justify restricted tactical exposure. Conversely, low-divergence signals reflect structural stability and support standard core risk allocations.
3. Real-Time Strategy Monitoring
Track the real-time divergence of systematic strategies in live deployment. If |Δ| begins expanding significantly while the trailing Standard Sharpe remains artificially high, it acts as an early warning metric. The statistical edge is deteriorating on a distribution level before it materializes visually in your trailing equity curve.
4. Portfolio Construction & Horizons
Prioritize assets displaying low structural divergence for long-term core holdings, given their statistically proven forward-persistence properties. High-divergence assets should be restricted to short-horizon, tactical momentum models.
5. Dynamic Exit Management
Monitor for sudden, unexpected spikes in indicator divergence during an open trade. A rapid expansion in |Δ| warns of structural decay in the underlying return distribution supporting the move. Use these spikes as automated risk flags to tighten trailing stops or systematically scale out of exposure.
*(Important Caveat: A divergence spike during an explosive, parabolic rally does not guarantee an immediate directional reversal; rather, it reflects extreme tail behavior characteristic of non-IID regimes. Treat it strictly as an automated cue to manage risk, not as an unconditional short signal).*
--------------------------------------------------------------------------
📋 CONCLUSION
The Adaptive Sharpe Ratio is not designed to replace classical metrics outright; rather, the divergence between ASR+ and Standard Sharpe functions as a powerful reliability filter for forward persistence. Both empirical tests confirm the same core thesis: a high nominal Sharpe is a necessary but insufficient condition for deploying capital. The underlying return distribution under which that performance was produced matters.
--------------------------------------------------------------------------
• Core Framework & Pine Script Code: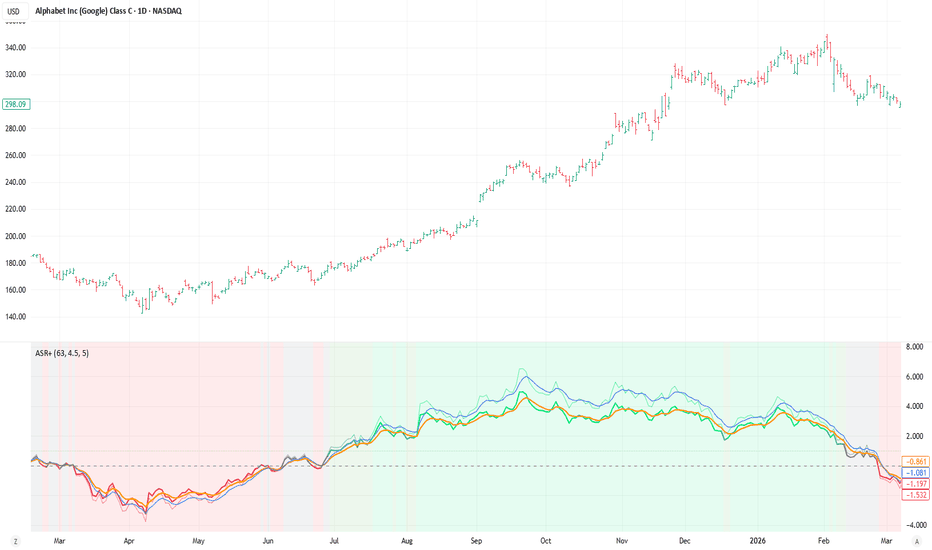
--------------------------------------------------------------------------
🔍 WHAT ASR+ IS (THE STRUCTURAL ANCHOR)
The classical Standard Sharpe Ratio (SSR) assumes that financial asset returns are independent, identically distributed (IID), and normal random variables. Real-world markets routinely violate all three assumptions through serial autocorrelation, volatility clustering, and fat-tailed return distributions. When these classical assumptions break down, standard Sharpe calculations become artificially inflated and unstable, underestimating true downside exposure precisely when risk measurement matters most.
ASR+ corrects for this by applying four distinct statistical adjustments simultaneously:
• HAC / Newey-West Correction: Uses a 4-lag Bartlett kernel to remove estimation bias caused by serial correlation in trending or mean-reverting regimes.
• Cornish-Fisher Tail Adjustment: Incorporates skewness and excess kurtosis into the risk estimate at the 95% confidence level, penalizing asymmetric or heavy-tailed distributions.
• Volatility Regime Penalty: Scales conservatism dynamically by assessing current volatility relative to its long-term historical average.
• Small-Sample Uncertainty Correction: Applies a bias correction to account for estimation errors on shorter lookback windows.
The result is a distribution-aware estimate of risk-adjusted performance that moderates inflated readings during highly unstable or non-IID market conditions.
--------------------------------------------------------------------------
📊 PART I — CROSS-SECTIONAL VALIDATION: WILCOXON SIGNED-RANK TEST
raw.githubusercontent.com/TrendAdvantage/tradingview-images/main/asr_scatter_with_table.png
To verify that ASR+ produces statistically distinct outputs from the Standard Sharpe Ratio rather than introducing redundant noise, a Wilcoxon signed-rank test was executed across 30 major tickers. The study utilized 63-day rolling metrics with 21-day stepped sampling over a 5-year window (2020–2025). The Wilcoxon test was selected because it makes no assumptions regarding the normality of the underlying distributions.
Key Results:
• Tickers with significant divergence (p < 0.05): 18 / 30
• Highly significant tickers (p < 0.001): 5 / 30
• Global Z-score: -12.51
• Global p-value: < 0.0001
• Median Delta (ASR+ - SSR): -0.0919
What the pattern reveals
The structural divergence is highly asset-specific and reveals that non-Gaussian return profiles affect defensive and growth equities alike. For example, as displayed in the
"ASR+ Reductions" data table, the consumer staple WMT experienced the largest global adjustment (-24.86%), outpacing high-beta growth engines like TSLA (-23.79%) and NVDA (-16.26%).
This highlights a critical reality: standard Sharpe estimates can heavily overstate risk-adjusted performance even in traditionally "defensive" assets if their underlying return streams
suffer from severe serial autocorrelation or structural tail-risk. ASR+ applies its strongest corrections dynamically across the board, precisely where these classical assumptions fail.
The Wilcoxon analysis established that the two measures diverge systematically; the next question was whether that divergence contains information about future signal quality.
--------------------------------------------------------------------------
⏱️ PART II — THE FORWARD PERSISTENCE AUDIT
raw.githubusercontent.com/TrendAdvantage/tradingview-images/main/adaptive_sharpe_audit-Final.png
While a Wilcoxon test confirms statistical divergence, it does not inherently prove forward-looking utility. If two separate assets display identical, highly attractive standard Sharpe Ratios, one may be driven by stable, persistent edge, while the other is an unstable artifact of structural noise or temporary volatility clustering.
To determine whether the magnitude of disagreement between the two metrics contains information about signal decay, a forward-persistence audit was conducted across 40 equities.
We define the absolute structural divergence parameter as:
|Δ| = |ASR+ - SSR|
Filtering exclusively for strong nominal performances (SSR > 1.0), observations were segregated into Low-|Δ| ("Reliable") and High-|Δ| ("Fragile") cohorts using tercile separation. The realized Sharpe Ratio was then tracked over the subsequent 63 trading days.
Audit Findings:
• High-|Δ| ("Fragile") signals experienced approximately 4.2× greater Sharpe decay over the forward 63-day window.
• Low-|Δ| ("Reliable") signals maintained materially stronger forward Sharpe persistence.
• The outperformance and group separation were verified as highly significant under a Mann-Whitney U test.
The divergence parameter (|Δ|) functions effectively as a structural reliability filter. An elevated nominal Sharpe accompanied by a large divergence gap indicates fragile, regime-dependent performance that decays rapidly back to market noise.
--------------------------------------------------------------------------
🛠️ PART III — PRACTICAL APPLICATIONS & LIVE EXECUTION
raw.githubusercontent.com/TrendAdvantage/tradingview-images/main/practical_implications.png
The following framework outlines exploratory applications derived directly from the forward-persistence audit data.
1. Signal & Entry Filtering
Before entering a position based on a strong nominal Sharpe value, examine the physical distance between the standard line and the adaptive line on your chart. A wide divergence gap (|Δ|) alerts you that the performance is regime-dependent or driven by temporary volatility clustering. Consider passing on setups where the structural divergence is abnormally elevated.
2. Risk Budgeting & Position Sizing
Incorporate the divergence parameter as a confidence scalar for capital allocation. Because high-divergence signals carry 4.2× more forward decay risk for the exact same nominal Sharpe reading, they justify restricted tactical exposure. Conversely, low-divergence signals reflect structural stability and support standard core risk allocations.
3. Real-Time Strategy Monitoring
Track the real-time divergence of systematic strategies in live deployment. If |Δ| begins expanding significantly while the trailing Standard Sharpe remains artificially high, it acts as an early warning metric. The statistical edge is deteriorating on a distribution level before it materializes visually in your trailing equity curve.
4. Portfolio Construction & Horizons
Prioritize assets displaying low structural divergence for long-term core holdings, given their statistically proven forward-persistence properties. High-divergence assets should be restricted to short-horizon, tactical momentum models.
5. Dynamic Exit Management
Monitor for sudden, unexpected spikes in indicator divergence during an open trade. A rapid expansion in |Δ| warns of structural decay in the underlying return distribution supporting the move. Use these spikes as automated risk flags to tighten trailing stops or systematically scale out of exposure.
*(Important Caveat: A divergence spike during an explosive, parabolic rally does not guarantee an immediate directional reversal; rather, it reflects extreme tail behavior characteristic of non-IID regimes. Treat it strictly as an automated cue to manage risk, not as an unconditional short signal).*
--------------------------------------------------------------------------
📋 CONCLUSION
The Adaptive Sharpe Ratio is not designed to replace classical metrics outright; rather, the divergence between ASR+ and Standard Sharpe functions as a powerful reliability filter for forward persistence. Both empirical tests confirm the same core thesis: a high nominal Sharpe is a necessary but insufficient condition for deploying capital. The underlying return distribution under which that performance was produced matters.
--------------------------------------------------------------------------
• Core Framework & Pine Script Code:
注释
### 📊 Research Graphics RestorationThe original asset server hosting the inline data graphics for this analysis experienced a permanent routing desynchronization. Below are the fully restored tables and cross-sectional validation graphics referenced in the research above.
#### I. CROSS-SECTIONAL VALIDATION: WILCOXON SIGNED-RANK TEST

#### II. THE FORWARD PERSISTENCE AUDIT

#### III. PRACTICAL APPLICATIONS & LIVE EXECUTION


免责声明
这些信息和出版物并非旨在提供,也不构成TradingView提供或认可的任何形式的财务、投资、交易或其他类型的建议或推荐。请阅读使用条款了解更多信息。
免责声明
这些信息和出版物并非旨在提供,也不构成TradingView提供或认可的任何形式的财务、投资、交易或其他类型的建议或推荐。请阅读使用条款了解更多信息。