
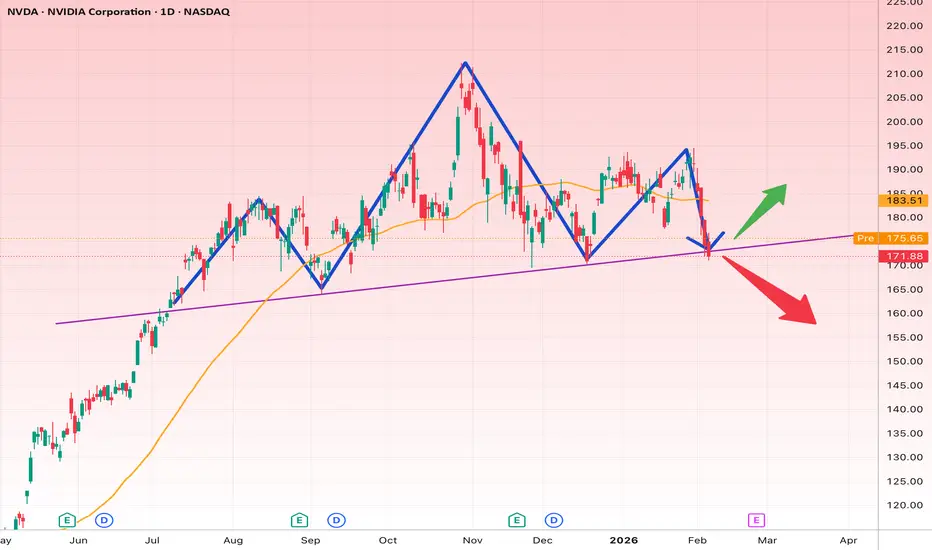
Price is sitting right on a rising trendline support around 172–175, which is a key decision zone.
Bullish scenario:
If this support holds, a rebound toward 183–190 is likely, aligning with prior swing highs and the moving average.
Bearish scenario:
A daily close below ~170 would signal a breakdown, opening downside toward 160–155.
Bias: Neutral → bullish only if trendline support holds.
Invalidation / Stop-loss: Below 170 (daily close).
This is a classic make-or-break level — wait for confirmation before committing.
Bullish scenario:
If this support holds, a rebound toward 183–190 is likely, aligning with prior swing highs and the moving average.
Bearish scenario:
A daily close below ~170 would signal a breakdown, opening downside toward 160–155.
Bias: Neutral → bullish only if trendline support holds.
Invalidation / Stop-loss: Below 170 (daily close).
This is a classic make-or-break level — wait for confirmation before committing.

免责声明
这些信息和出版物并非旨在提供,也不构成TradingView提供或认可的任何形式的财务、投资、交易或其他类型的建议或推荐。请阅读使用条款了解更多信息。
免责声明
这些信息和出版物并非旨在提供,也不构成TradingView提供或认可的任何形式的财务、投资、交易或其他类型的建议或推荐。请阅读使用条款了解更多信息。