
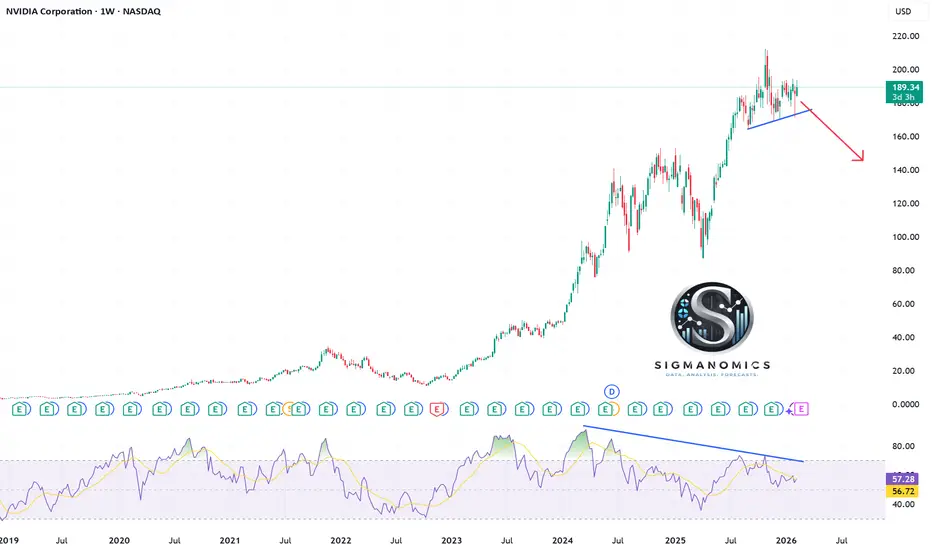
For those afraid of heights, Nvidia price action is warning of a correction in the medium term. To date, price action is holding above weekly trend line support at 176; however, a break below could expose a deeper pullback into the 150-140 zone, with the viewpoint supported by bearish RSI divergence that has developed since 2024. Meanwhile, there is a daily head and shoulders forming, with bears looking for confirmation on a break and close below support.

📊 Data. Analysis. Forecasts.
Cut through the noise → sigmanomics.com
📅 Never miss a market mover
Economic Calendar → sigmanomics.com/economic-calendar
🎯 Stop guessing. Start forecasting.
sigmanomics.com/forecasts
Cut through the noise → sigmanomics.com
📅 Never miss a market mover
Economic Calendar → sigmanomics.com/economic-calendar
🎯 Stop guessing. Start forecasting.
sigmanomics.com/forecasts
免责声明
这些信息和出版物并非旨在提供,也不构成TradingView提供或认可的任何形式的财务、投资、交易或其他类型的建议或推荐。请阅读使用条款了解更多信息。
📊 Data. Analysis. Forecasts.
Cut through the noise → sigmanomics.com
📅 Never miss a market mover
Economic Calendar → sigmanomics.com/economic-calendar
🎯 Stop guessing. Start forecasting.
sigmanomics.com/forecasts
Cut through the noise → sigmanomics.com
📅 Never miss a market mover
Economic Calendar → sigmanomics.com/economic-calendar
🎯 Stop guessing. Start forecasting.
sigmanomics.com/forecasts
免责声明
这些信息和出版物并非旨在提供,也不构成TradingView提供或认可的任何形式的财务、投资、交易或其他类型的建议或推荐。请阅读使用条款了解更多信息。