
NVIDIA (NVDA) Daily Analysis
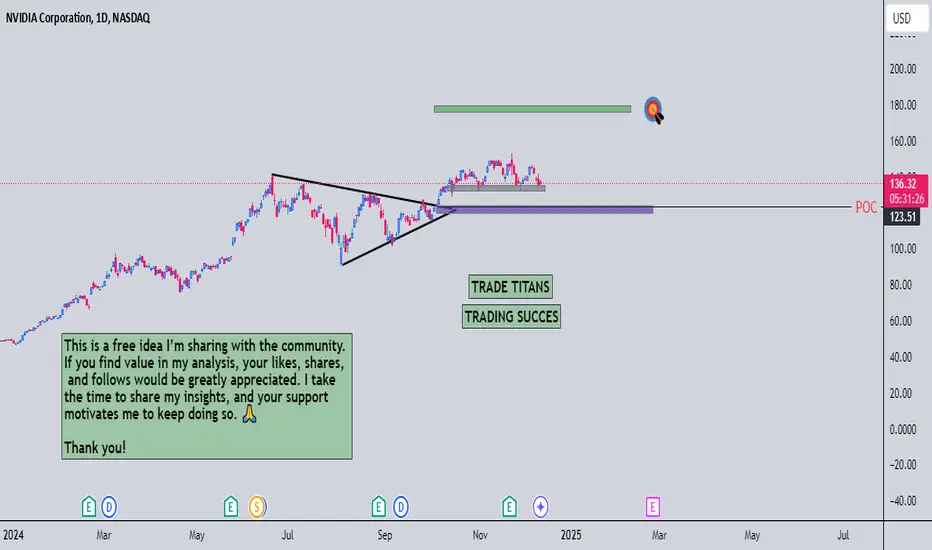
On the daily time frame, NVIDIA has already broken out of a triangle pattern and is now forming a potential head and shoulders pattern. Here’s the breakdown of the current structure:
Gray support zone: A critical level to monitor. If this level breaks, the next significant support is the purple support zone, which also aligns with the Point of Control (POC) at this level.
If the price retraces to the purple support zone, it could present a potential entry opportunity with proper confirmation.
Based on the projection from the triangle breakout, the green zone remains a key target for later upward momentum.
This is a free idea I’m sharing with the community. If you find value in my analysis, your likes, shares, and follows would be greatly appreciated. I take the time to share my insights, and your support motivates me to keep doing so. 🙏
Thank you!

免责声明
这些信息和出版物并非旨在提供,也不构成TradingView提供或认可的任何形式的财务、投资、交易或其他类型的建议或推荐。请阅读使用条款了解更多信息。
免责声明
这些信息和出版物并非旨在提供,也不构成TradingView提供或认可的任何形式的财务、投资、交易或其他类型的建议或推荐。请阅读使用条款了解更多信息。