
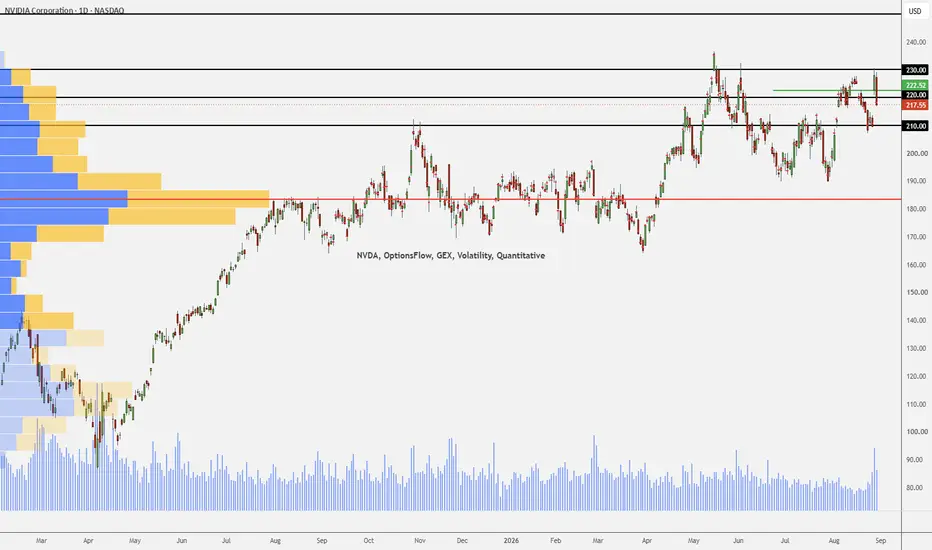
Following the recent earnings release, I analyze institutional positioning across the NVIDIA ($217.88) options chain to define key support, resistance, and liquidity levels for the upcoming trading sessions
**Quantitative Breakdown:
- Short-Term (1-4 Days): Range $215 – $220. Gamma wall at $220. A breakout above $220 opens the path to $225.
- Medium-Term (September): Support $200 / Target $230 – $240. Strong Call flow bias.
- Long-Term (Oct / Nov): Floor $175 / Upper Target $250. Healthy institutional market structure.
**Quantitative Analysis:
1. Market Diagnosis & Flow Bias:
- Sustained Bullish Sentiment: The Volume Put/Call Ratio at 0.59 (nearly 2 Calls traded for every Put) and the Open Interest Put/Call Ratio at 0.77 confirm continuous structural bullish positioning in the derivatives market.
- Volatility Contraction (IV Crush): Implied Volatility dropped to 2.02%, trading below Historical Volatility (2.50%). Earnings event uncertainty has fully collapsed out of option premiums.
2. Short-Term Key Levels (1 to 4 Days)
Resistance Wall: $220.00 Call Wall
- The Obstacle: Holds a massive 92.9K volume in the $220 Call. Market makers act as passive sellers near this strike.
- The Catalyst: To trigger a broader move (Gamma Squeeze) toward $225 and $230, NVDA needs to break and consolidate above $220.00 with high spot volume.
2.1 Immediate Support: $215.00 – $210.00 Put Wall
- Short-term buyer liquidity is concentrated at $215 (38.8K volume) and $210 (22.2K volume / 9.33K OI).
- Expected Scenario: A compressed range between $215 (support) and $220 (gamma wall) in the near term.
3. Medium & Long-Term Structure (Sep / Oct / Nov)
- Contango Volatility Curve: The IV term structure slopes upward toward late-year expirations (macro risks & Q3 earnings), allowing traders to enter longer-dated options without overpaying for short-term premium.
- Major Call Wall ($250 & $300): The largest absolute Open Interest accumulation across Sep/Oct/Nov rests at the $250 strike (>150K contracts).
- Downside Tail Protection ($175 & $200): Open Interest spikes at $175 and $200 show institutions are buying cheap Out-of-the-Money hedges rather than near-the-money protection, reinforcing the health of the broader trend.
**Quantitative Breakdown:
- Short-Term (1-4 Days): Range $215 – $220. Gamma wall at $220. A breakout above $220 opens the path to $225.
- Medium-Term (September): Support $200 / Target $230 – $240. Strong Call flow bias.
- Long-Term (Oct / Nov): Floor $175 / Upper Target $250. Healthy institutional market structure.
**Quantitative Analysis:
1. Market Diagnosis & Flow Bias:
- Sustained Bullish Sentiment: The Volume Put/Call Ratio at 0.59 (nearly 2 Calls traded for every Put) and the Open Interest Put/Call Ratio at 0.77 confirm continuous structural bullish positioning in the derivatives market.
- Volatility Contraction (IV Crush): Implied Volatility dropped to 2.02%, trading below Historical Volatility (2.50%). Earnings event uncertainty has fully collapsed out of option premiums.
2. Short-Term Key Levels (1 to 4 Days)
Resistance Wall: $220.00 Call Wall
- The Obstacle: Holds a massive 92.9K volume in the $220 Call. Market makers act as passive sellers near this strike.
- The Catalyst: To trigger a broader move (Gamma Squeeze) toward $225 and $230, NVDA needs to break and consolidate above $220.00 with high spot volume.
2.1 Immediate Support: $215.00 – $210.00 Put Wall
- Short-term buyer liquidity is concentrated at $215 (38.8K volume) and $210 (22.2K volume / 9.33K OI).
- Expected Scenario: A compressed range between $215 (support) and $220 (gamma wall) in the near term.
3. Medium & Long-Term Structure (Sep / Oct / Nov)
- Contango Volatility Curve: The IV term structure slopes upward toward late-year expirations (macro risks & Q3 earnings), allowing traders to enter longer-dated options without overpaying for short-term premium.
- Major Call Wall ($250 & $300): The largest absolute Open Interest accumulation across Sep/Oct/Nov rests at the $250 strike (>150K contracts).
- Downside Tail Protection ($175 & $200): Open Interest spikes at $175 and $200 show institutions are buying cheap Out-of-the-Money hedges rather than near-the-money protection, reinforcing the health of the broader trend.

免责声明
这些信息和出版物并非旨在提供,也不构成TradingView提供或认可的任何形式的财务、投资、交易或其他类型的建议或推荐。请阅读使用条款了解更多信息。
免责声明
这些信息和出版物并非旨在提供,也不构成TradingView提供或认可的任何形式的财务、投资、交易或其他类型的建议或推荐。请阅读使用条款了解更多信息。